Fig. 1
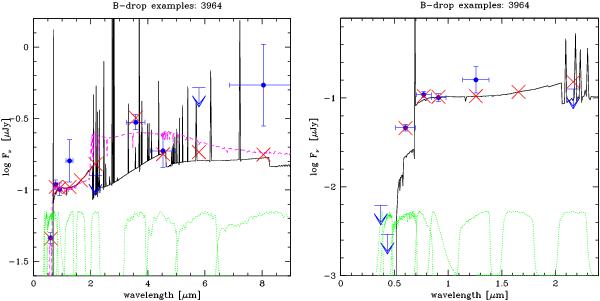
Example of an SED fit for B-drop galaxy best fit with strong Lyα. Black solid line: best-fit SED including nebular emission. Red crosses: flux in the photometric bands derived from the SED including nebular emission. Blue symbols show the observed fluxes or 1σ upper limits. Green dashed lines show the positions/shape of all the availabe photometric bands. Left: full SED showing all the available photometric data. Right: zoom on the SED showing the spectral range up to 2.4 μm only (restframe UV to Balmer break).
Current usage metrics show cumulative count of Article Views (full-text article views including HTML views, PDF and ePub downloads, according to the available data) and Abstracts Views on Vision4Press platform.
Data correspond to usage on the plateform after 2015. The current usage metrics is available 48-96 hours after online publication and is updated daily on week days.
Initial download of the metrics may take a while.