Fig. 3
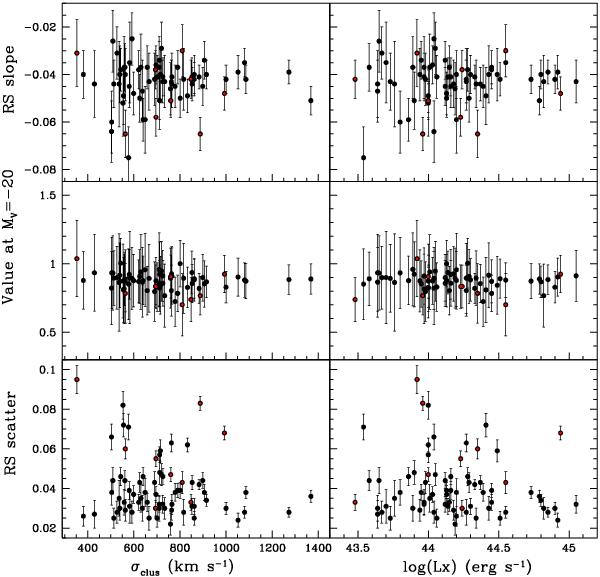
Slope, value of best fit line at MV = −20 and scatter of the median RS values of the 100 Monte Carlo runs for each cluster versus cluster velocity dispersion (σclus, left panels) and cluster X-ray luminosity (LX, right panels). Error bars refer to the error of the median of the 100 simulations. In red (on-line version), clusters whose RS is contaminated by another structure (see text).
Current usage metrics show cumulative count of Article Views (full-text article views including HTML views, PDF and ePub downloads, according to the available data) and Abstracts Views on Vision4Press platform.
Data correspond to usage on the plateform after 2015. The current usage metrics is available 48-96 hours after online publication and is updated daily on week days.
Initial download of the metrics may take a while.