Fig. 2
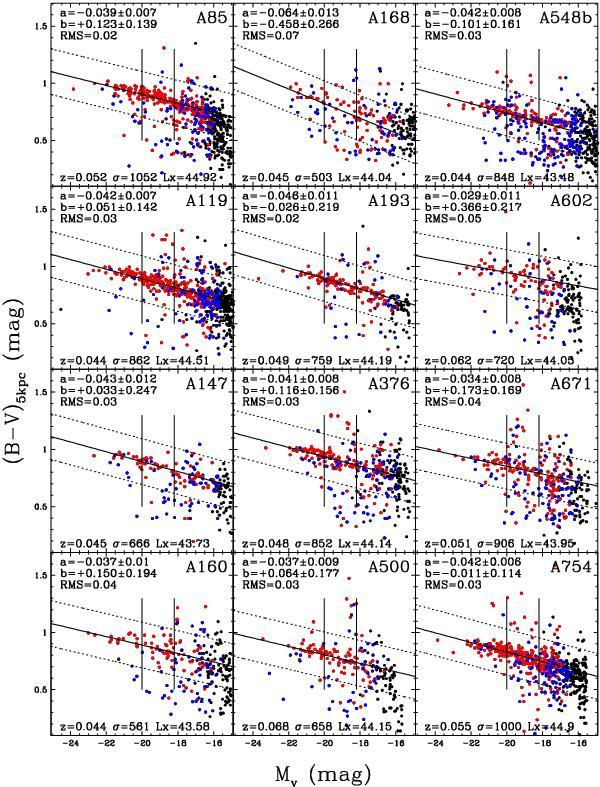
A random realization of the Monte Carlo interloper subtraction technique. Only galaxies assigned to the clusters are shown: red dots are morphologically early-type galaxies (Es and S0s), blue dots are late-type ones and black dots are galaxies with no available morphological classification (colors only available in the on-line version). The best-fitted RS of the 100 realizations is drawn (solid black line) with ± 0.2 mag limits (dashed black lines) identifying the red sequence. The rms numerical values are reported at the top of each panel. The global properties of each cluster are reported, for reference, at the bottom of each panel. The vertical lines mark the absolute V magnitude limits used to define the luminous and the faint population of the RS.
Current usage metrics show cumulative count of Article Views (full-text article views including HTML views, PDF and ePub downloads, according to the available data) and Abstracts Views on Vision4Press platform.
Data correspond to usage on the plateform after 2015. The current usage metrics is available 48-96 hours after online publication and is updated daily on week days.
Initial download of the metrics may take a while.