Fig. 1
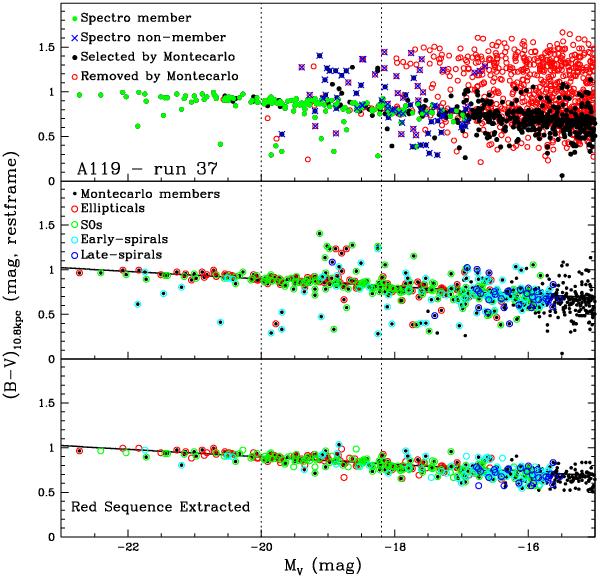
Visual example of a Monte Carlo realization for the cluster Abell 119. In the upper panel, the red empty dots and the black filled dots are the non-members and members assigned by the simulation (run 37th), respectively. Shown as green circles and blue crosses are the spectroscopic members and non-members, respectively. In the middle panel, only members according to the Monte Carlo realization are shown, but divided into different morphological types (see legend and the figure in electronic format). In the bottom panel, the RS extracted is shown, again with the morphological color coding. The dotted vertical lines mark the absolute V magnitude limits used to define the luminous and faint population on the RS.
Current usage metrics show cumulative count of Article Views (full-text article views including HTML views, PDF and ePub downloads, according to the available data) and Abstracts Views on Vision4Press platform.
Data correspond to usage on the plateform after 2015. The current usage metrics is available 48-96 hours after online publication and is updated daily on week days.
Initial download of the metrics may take a while.