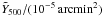
Table 1
Scaled Planck SZ signal measurements  binned by N200 for the Rozo et al. (2009) mass-richness relation.
| N200 |
|
Stat. uncertainty | Total uncertainty |
|
|
|||
| 10–13 | 2.0 | ± 0.3 | ± 0.3 |
| 14–17 | 3.8 | ± 0.6 | ± 0.6 |
| 18–24 | 8.2 | ± 0.7 | ± 0.7 |
| 25–32 | 15 | ± 1 | ± 1 |
| 33–43 | 27 | ± 2 | ± 2 |
| 44–58 | 48 | ± 3 | ± 4 |
| 59–77 | 76 | ± 4 | ± 8 |
| 78–104 | 190 | ± 9 | ± 40 |
| >105 | 300 | ± 20 | ± 80 |
Notes. Given values are the measurement-noise weighted mean in the bin. The statistical uncertainty corresponds to the measurement-noise uncertainty on the weighted mean, while the total uncertainty expresses the standard deviation of the weighted mean from an ensemble of bootstrap samples. This table is plotted as the red diamonds and error bars in the right-hand panel of Fig. 2.
Current usage metrics show cumulative count of Article Views (full-text article views including HTML views, PDF and ePub downloads, according to the available data) and Abstracts Views on Vision4Press platform.
Data correspond to usage on the plateform after 2015. The current usage metrics is available 48-96 hours after online publication and is updated daily on week days.
Initial download of the metrics may take a while.