Fig.4
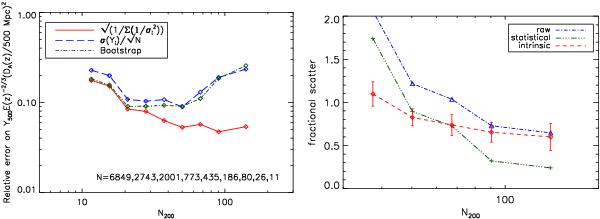
Dispersion analysis. Left-hand panel: relative uncertainty on the mean versus richness. The relative uncertainty is expressed as a fraction of the bin-average redshift-scaled SZ signal:  . The lower red curve corresponds to pure measurement uncertainties from the matched filter noise estimations; they are the solid error bars of Fig. 2. The upper blue curve traces the uncertainty on the mean assuming the points within a richness bin are normally distributed according to the observed in-bin dispersion. Bootstrap uncertainties are given as the middle green line, found as the dispersion in the mean
  in each bin calculated over 10000 bootstrap realisations of the entire MaxBCG catalogue. The numbers given in the legend indicate the number of objects in each richness bin. Right-hand panel: fractional intrinsic scatter as a function of richness. The blue dot-dashed line (connecting the blue triangles) shows the raw dispersion in each richness bin, while the green dash-three-dotted line (connecting the green crosses) gives the calculated statistical dispersion from the measurement error on the scaled SZ signal . The red dashed line with error bars is our estimation of the intrinsic scatter as a function of richness. For this calculation we have eliminated outliers in each bin at > 5σ, with
  for each cluster. We only calculate the intrinsic scatter at N200 > 30, because at lower richness it becomes difficult to separate the intrinsic dispersion from the scatter due to pure measurement error.
Current usage metrics show cumulative count of Article Views (full-text article views including HTML views, PDF and ePub downloads, according to the available data) and Abstracts Views on Vision4Press platform.
Data correspond to usage on the plateform after 2015. The current usage metrics is available 48-96 hours after online publication and is updated daily on week days.
Initial download of the metrics may take a while.