Fig.3
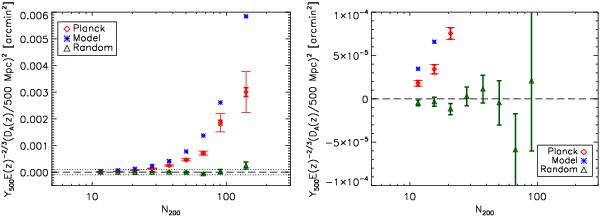
Null test performed by randomising the angular positions of the clusters. The red diamonds show the bin-average, redshift-scaled measurements,  , as reported in the left-hand side of Fig. 2 with their corresponding measurement and bootstrap uncertainties; blue stars are the same model points. The green triangles present the bin-averages for the randomised catalogue with uncertainties given only by the SZ measurement errors. Results for the randomised catalogue are consistent with zero within their uncertainties. By comparison, the values for the real catalogue represent highly significant detections of the SZ signal in all richness bins. Left-hand panel: results over the full richness range. Right-hand panel: zoom into the region indicated by the dotted lines in the left-hand panel to highlight the low-richness end.
Current usage metrics show cumulative count of Article Views (full-text article views including HTML views, PDF and ePub downloads, according to the available data) and Abstracts Views on Vision4Press platform.
Data correspond to usage on the plateform after 2015. The current usage metrics is available 48-96 hours after online publication and is updated daily on week days.
Initial download of the metrics may take a while.