Fig.1
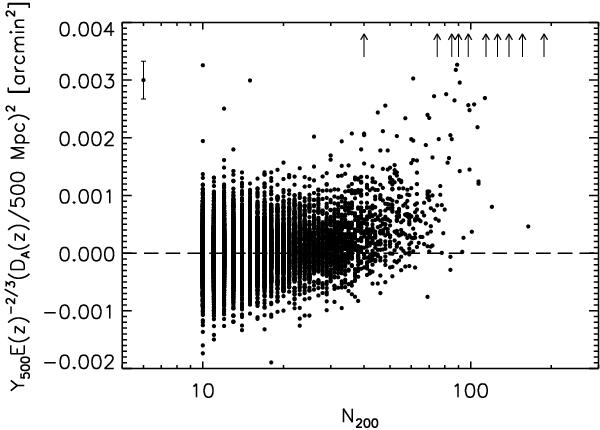
Individual scaled SZ signal measurements,  , for the MaxBCG catalogue as a function of richness N200. We do not plot individual error bars to avoid saturating the figure. The error bar drawn in the upper left represents the median uncertainty over the entire population; in general, the uncertainty increases towards low richness. The SZ signal measurements are expressed as the Compton y parameter integrated over a sphere out to R500, scaled in redshift according to the self-similar model and placed at a fiducial angular distance of 500 Mpc. Each point represents the result of the matched filter applied to an individual cluster in the catalogue. Upward pointing arrows indicate values beyond the plotted range. The radius R500, and hence the filter size, is set from the mass of each cluster determined via the weak-lensing calibrated M500 − N200 relation given by Johnston et al. (2007). The results are nearly the same for the relation given by Rozo et al. (2009).
Current usage metrics show cumulative count of Article Views (full-text article views including HTML views, PDF and ePub downloads, according to the available data) and Abstracts Views on Vision4Press platform.
Data correspond to usage on the plateform after 2015. The current usage metrics is available 48-96 hours after online publication and is updated daily on week days.
Initial download of the metrics may take a while.