Fig. 19
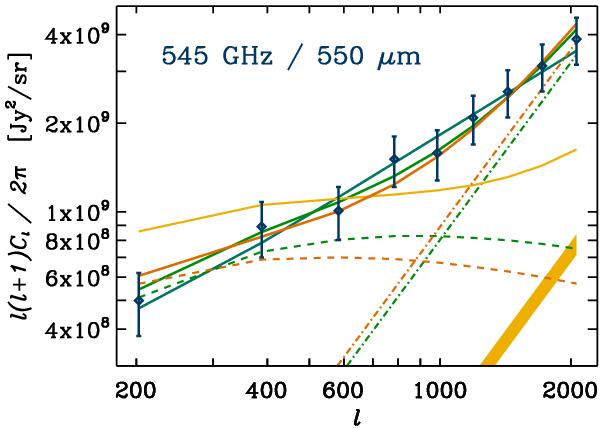
In this plot we illustrate the constant bias model at 545 GHz. The orange (solid, dashed and dot-dashed) lines correspond to the best-fit linear model, its clustering component, and the shot-noise level, respectively. While this fit was performed using our fiducial emissivity defined in Eq. (38), for illustrative purpose we plot in green the analogous fit using the LDP emissivity. In both cases the required shot-noise level (dot-dashed lines) is well above the 68% C.L. predicted by Béthermin et al. (2011) and given in Table 5 (yellow contour). Conversely, the solid yellow line represents the best-fit curve when the shot-noise level is fixed to the expected value (Table 3) and only the constant bias is varied. The fit is obviously unsatisfactory. These results lead us to consider the linear bias model as unphysical, despite the good fit it provides (χ2/d.o.f. ≃ 0.36 (2.52/7)). For illustration purpose, we also show our best-fit power-law model defined in Eq. (42) (blue solid line).
Current usage metrics show cumulative count of Article Views (full-text article views including HTML views, PDF and ePub downloads, according to the available data) and Abstracts Views on Vision4Press platform.
Data correspond to usage on the plateform after 2015. The current usage metrics is available 48-96 hours after online publication and is updated daily on week days.
Initial download of the metrics may take a while.