Fig. 15
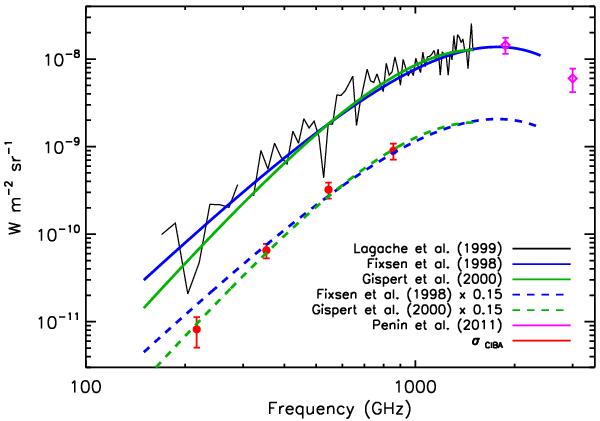
Comparison of the observed CIB mean and anisotropy SED. The CIB measurements are from Lagache et al. (1999) (FIRAS spectrum in black) and Pénin et al. (2011b) (Spitzer and IRIS, pink diamond data points). The green and blue continuous (dashed) lines are the CIB fits from Gispert et al. (2000) and Fixsen et al. (1998) (multiplied by 0.15). The rms fluctuations of the CIB anisotropies, measured for 200 < ℓ < 2000, are shown with the red dots. Their error bars include both statistical and photometric calibration systematic errors (linearly added), as given in Table 5. This figure shows that the CIB anisotropy SED is steeper than the Fixsen et al. (1998) best fit but very close to the Gispert et al. (2000) best fit. We see no evidence for different CIB mean and anisotropy SED.
Current usage metrics show cumulative count of Article Views (full-text article views including HTML views, PDF and ePub downloads, according to the available data) and Abstracts Views on Vision4Press platform.
Data correspond to usage on the plateform after 2015. The current usage metrics is available 48-96 hours after online publication and is updated daily on week days.
Initial download of the metrics may take a while.