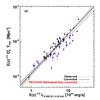
Fig.5
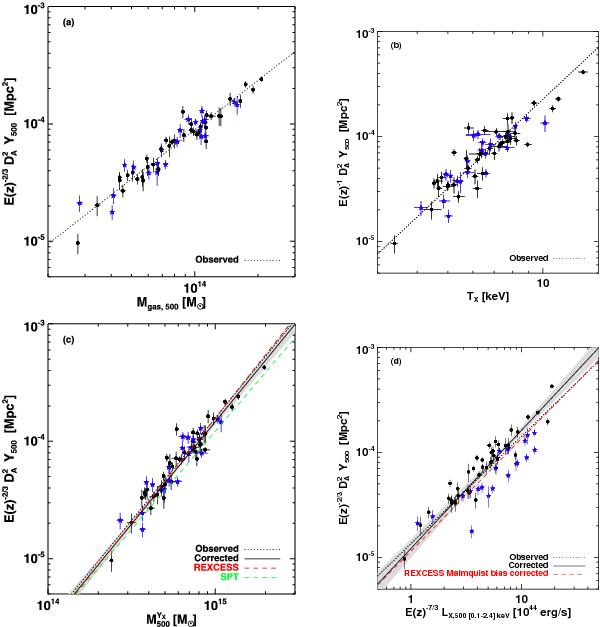
Scaling relations for the 62 clusters in the Planck-XMM-Newton archive sample; fits are given in Table 2. Cool core systems are plotted as blue stars, other systems as black dots. In the upper panels, the dotted line denotes the observed scaling relation fit. In the lower panels, the dotted line denotes the observed scaling relation fit, while the solid line shows the fit once the effects of selection bias are taken into account. The grey shaded area indicates the 1σ uncertainty. The SPT results are taken from Andersson et al. (2011).
Current usage metrics show cumulative count of Article Views (full-text article views including HTML views, PDF and ePub downloads, according to the available data) and Abstracts Views on Vision4Press platform.
Data correspond to usage on the plateform after 2015. The current usage metrics is available 48-96 hours after online publication and is updated daily on week days.
Initial download of the metrics may take a while.