Fig. 7
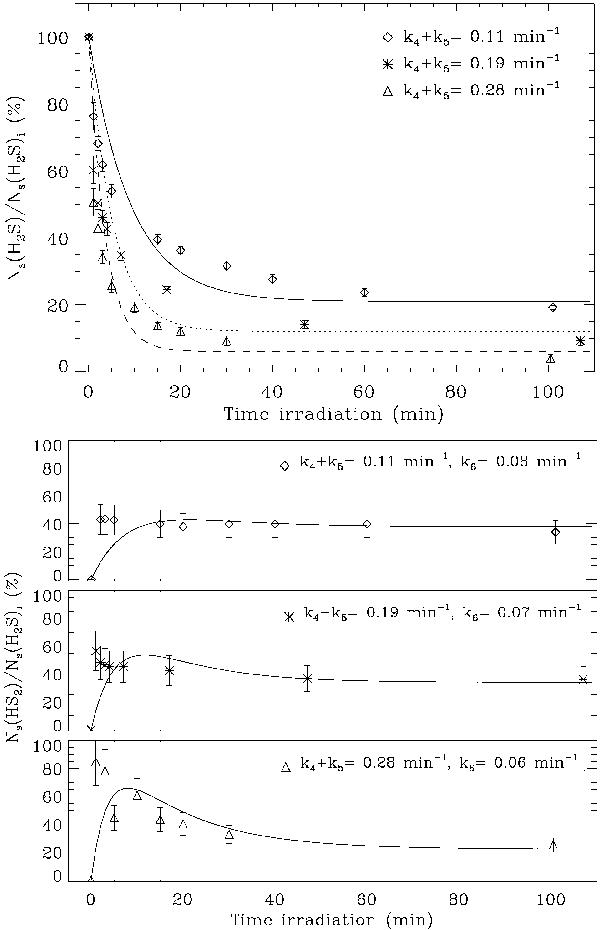
Destruction of H2S and formation of HS during UV irradiation. Top: data points corresponding to S7 (asterisks), S8 (diamonds), and S9 (triangles) experiments, see Table 1. For each experiment, the integrated absorbance values of the 2550 cm-1 band of H2S ice as a function of UV irradiation time, Ns(H2S), were normalized with respect to their initial values before irradiation, Ns(H2S)i. The fits were made using Eq. (10) and rate constant values displayed in the figure. Error bars represent the standard deviation in each experiment. Bottom: normalized integrated absorbance values of the 2483 cm-1 band attributed to the HS
 product as a function of UV irradiation time, corresponding to S7 (asterisks), S8 (diamonds), and S9 (triangles), see Table 1. Normalization was done with respect to the integrated absorbance values of the 2483 cm-1 band after the same irradiation time. The solid line is a fit using Eq. (11) and rate constants displayed in the figure.
Current usage metrics show cumulative count of Article Views (full-text article views including HTML views, PDF and ePub downloads, according to the available data) and Abstracts Views on Vision4Press platform.
Data correspond to usage on the plateform after 2015. The current usage metrics is available 48-96 hours after online publication and is updated daily on week days.
Initial download of the metrics may take a while.