Free Access
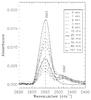
Fig. 6
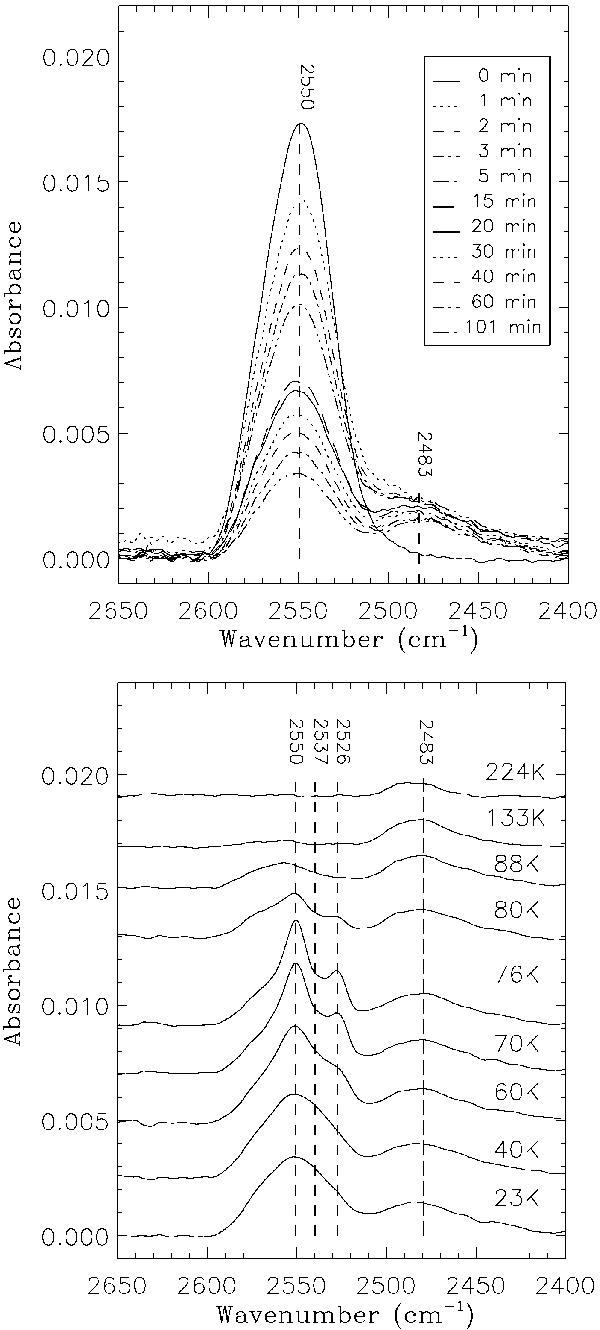
Top: infrared spectra of H2S ice at 7 K for different irradiation times, corresponding to experiment S8 of Table 1. Bottom: for the same experiment, infrared spectra of the irradiated sample collected at different temperatures during warm-up.
This figure is made of several images, please see below:
Current usage metrics show cumulative count of Article Views (full-text article views including HTML views, PDF and ePub downloads, according to the available data) and Abstracts Views on Vision4Press platform.
Data correspond to usage on the plateform after 2015. The current usage metrics is available 48-96 hours after online publication and is updated daily on week days.
Initial download of the metrics may take a while.