Fig. 8
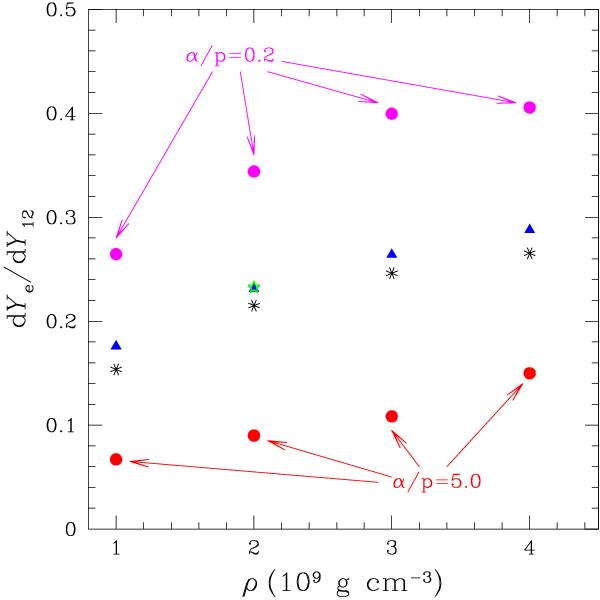
Average derivative of the electron molar fraction with respect to the 12C molar fraction during carbon simmering, as a function of density for different carbon fusion rates: CF88 (black asterisks), LER-1.5-0.1-1.0 (blue triangles), LER-1.5-0.001-1.0 and LER-1.5-10.-1.0 (green stars), and LER-1.5-0.1-5.0 and LER-1.5-0.1-0.2 (red and magenta circles, respectively). All the models shown in this panel were computed at constant density. The models with the extreme resonance strengths were computed only at ρ = 2 × 10⁹ g cm-3.
Current usage metrics show cumulative count of Article Views (full-text article views including HTML views, PDF and ePub downloads, according to the available data) and Abstracts Views on Vision4Press platform.
Data correspond to usage on the plateform after 2015. The current usage metrics is available 48-96 hours after online publication and is updated daily on week days.
Initial download of the metrics may take a while.