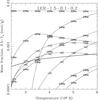
Fig. 6
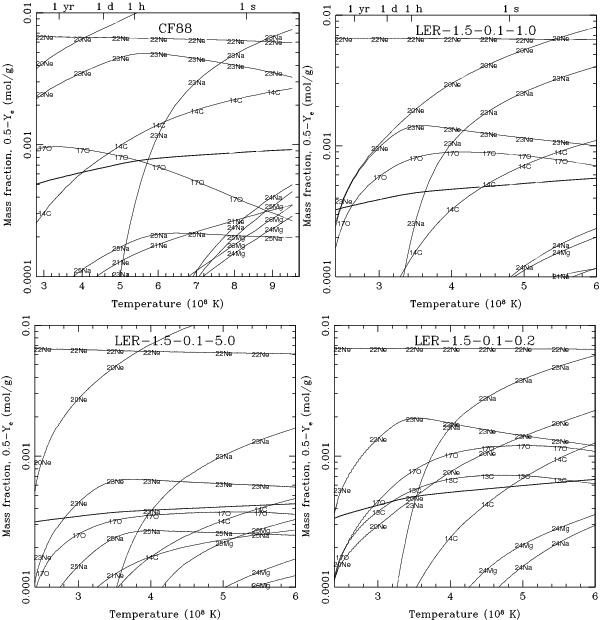
Evolution of the chemical composition at the center of the white dwarf as a function of temperature for different 12C+12C rates: CF88 rate (top left), LER-1.5-0.1-1.0 model (top right), and α/p: LER-1.5-0.1-5.0 with α/p = 5.0 (bottom left), and LER-1.5-0.1-0.2 with α/p = 0.2 (bottom right). To improve the readability, the upper limit to the vertical axis has been set at a mass fraction of 0.01, hence the curves of 12C and 16O (both with mass fractions > 0.1) lie out of the plot (the relative variations in their mass fractions are very tiny within the temperature range shown). The thick curve gives the electron molar fraction. The abundance of 23Ne reflects the amount of electron captures on 23Na: it grows quickly with increasing temperature at low temperatures but levels out at T ~ 5.5 × 10⁸ K for the CF88 model and T ~ 3.5 × 10⁸ K for the rest of the models shown. The sum of the abundances of 17O and 14C reflect the electron captures on 13N: the sum grows steadily but is always smaller than the abundance of 23Ne, except at very high temperatures. The top axes of the plots belonging to models CF88 and LER-1.5-0.1-1.0 are labeled with the time to runaway.
Current usage metrics show cumulative count of Article Views (full-text article views including HTML views, PDF and ePub downloads, according to the available data) and Abstracts Views on Vision4Press platform.
Data correspond to usage on the plateform after 2015. The current usage metrics is available 48-96 hours after online publication and is updated daily on week days.
Initial download of the metrics may take a while.