Fig. 4
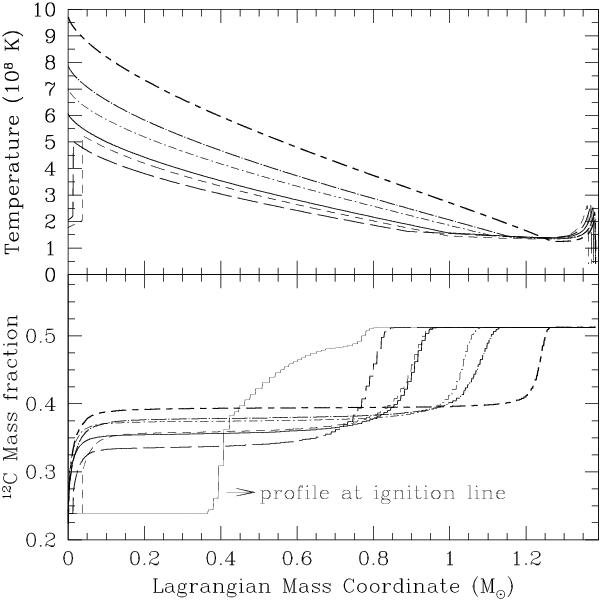
Thermal and chemical profiles at the crossing of the dynamical curves. The line types used for the models from Table 1 are the same as those used in Fig. 2. Top panel: temperature profiles. From top to bottom (at M ~ 0.2 M⊙) the curves belong to models CF88, LER-1.5-0.001-1.0, LER-1.7-0.1-1.0, LER-1.5-0.1-1.0, LER-1.3-0.1-1.0, and LER-1.5-10.-1.0. Note that the last two models run away off-center. Bottom panel: 12C mass fraction profiles. For comparison purposes, we have plotted with a thin solid line the profile of model CF88 at the crossing of the ignition curve. As can be easily appreciated, the extension of the convective core is very sensitive to the inclusion of a LER in the 12C+12C reaction rate.
Current usage metrics show cumulative count of Article Views (full-text article views including HTML views, PDF and ePub downloads, according to the available data) and Abstracts Views on Vision4Press platform.
Data correspond to usage on the plateform after 2015. The current usage metrics is available 48-96 hours after online publication and is updated daily on week days.
Initial download of the metrics may take a while.