Fig. 3
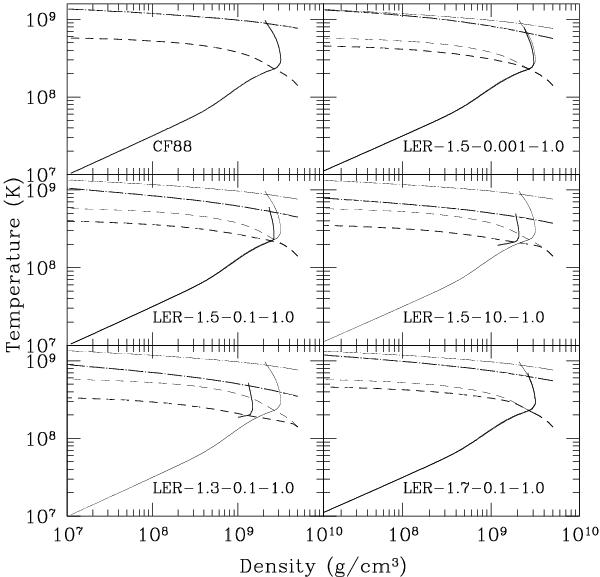
Changes in the physics of the accretion phase owing to a LER: ignition curves (dashed lines), dynamical curve (dot-dashed lines), and track of central ρ vs. T during the hydrostatic evolution (solid lines). The top left panel shows the results obtained when the 12C+12C rate was computed following CF88, the other panels show the results adding a LER to that rate (see Table 1). For comparison purposes, in all the panels we have drawn the CF88 curves as thin lines. In the panels belonging to the LER-1.5-10.-1.0 and LER-1.3-0.1-1.0 rates, the track belongs to the evolution of the shell that first crosses the dynamical curve. We assumed a chemical composition made of 50% 12C and 50% 16O for both curves, while the hydrostatic ρ-T tracks were computed with the realistic chemical composition obtained from full stellar evolutionary calculations (FRANEC code).
Current usage metrics show cumulative count of Article Views (full-text article views including HTML views, PDF and ePub downloads, according to the available data) and Abstracts Views on Vision4Press platform.
Data correspond to usage on the plateform after 2015. The current usage metrics is available 48-96 hours after online publication and is updated daily on week days.
Initial download of the metrics may take a while.