| Issue |
A&A
Volume 535, November 2011
|
|
|---|---|---|
| Article Number | A108 | |
| Number of page(s) | 8 | |
| Section | Extragalactic astronomy | |
| DOI | https://doi.org/10.1051/0004-6361/201117505 | |
| Published online | 21 November 2011 | |
The energetics of giant radio galaxy lobes from inverse Compton scattering observations
1
INAF – Osservatorio Astronomico di Roma via Frascati 33, 00040
Monteporzio,
Italy
e-mail: sergio.colafrancesco@oa-roma.inaf.it
2
School of Physics, University of the Witwatersrand,
Johannesburg Wits
2050, South
Africa
e-mail: sergio.colafrancesco@wits.ac.za
3
Dipartimento di Fisica, Università di Roma La
Sapienza, P.le A. Moro
2, Roma,
Italy
e-mail: paolo.marchegiani@oa-roma.inaf.it
Received:
17
June
2011
Accepted:
18
August
2011
Context. Giant radio galaxy (GRG) lobes are excellent laboratories for studying the evolution of the particle and magnetic field energetics and the past activity of radiogalaxy jets, as indicated by recent results of X-ray observations with Suzaku. However, these results are based on assumptions of the shape and extension of the GRG lobe electron spectrum.
Aims. We re-examine the energetics of GRG lobes as derived by inverse Compton scattering of cosmic microwave background (CMB) photons (ICS-CMB) by relativistic electrons in RG lobes to assess the realistic physical conditions of RG lobes, their energetics, and their radiation regime. We consider the steep-spectrum GRG DA 240 recently observed by Suzaku as a reference case and we also discuss other RG lobes observed with Chandra and XMM.
Methods. We model the spectral energy distribution (SED) of the GRG DA 240 East lobe to obtain constraints on the shape and on the extension of the electron spectrum by using multi-frequency information from radio to gamma-rays. We use radio and X-ray data to constrain the shape and normalization of the electron spectrum and we then calculate the Sunyaev-Zel’dovich (SZ) effect expected in GRG lobes that is sensitive to the total electron energy density.
Results. We show that the electron energy density Ue derived form X-ray observations can yield only a rough lower limit to its actual value and that most of the estimates of Ue based on X-ray measurements have to be increased even by a large factor by considering realistic estimates of the lower electron momentum p1. This moves RG lobes away from the equipartition condition toward a particle-dominated and Compton power dominance regime. We propose to use the distribution of RG lobes in the Ue/UB vs. Ue/UCMB plane as another divide divide between the different physical regimes of particle and field dominance and radiation mechanism dominance in RG lobes.
Conclusions. We conclude that the SZ effect produced by ICS-CMB mechanism observable in RG lobes provides reliable estimate of p1 and Ue and is the best tool to determine the total energy density of RG lobes and to assess their physical regime. This observational tool is available with the sensitive high-frequency radio and mm experiments.
Key words: cosmic background radiation / galaxies: active / cosmology: theory
© ESO, 2011
1. Introduction
Giant radio galaxy (GRG) lobes are considered the final stage of the evolution of radiogalaxy (RG) jets and are likely the evolutionary connection to the inverse Compton ghosts of GRGs. The details of this evolutionary process are, however, not yet satisfactorily understood. In this context, GRG lobes are excellent laboratories for studying the evolution of the particle and magnetic field energy density as well as the past activity of RG jets.
Determining the total particle and magnetic energy density in GRG lobes is a difficult task because of the lack of precise indicators of the overall particle energy spectrum (especially in the low-energy part, where most of the energy is stored in steep spectrum sources) and of the distribution and power spectrum of the magnetic field.
The electron and magnetic energies stored in GRG lobes are usually measured through the diffuse radio synchrotron emission and the inverse Compton scattering (ICS) X-ray emission where these X-rays are produced by cosmic microwave background (CMB) photons up-scattered by the ICS with the relativistic electrons (hereafter ICS-CMB) injected to the GRG lobe.
The results of the ICS-CMB X-ray emission from RG lobes obtained with ROSAT (e.g. Feigelson et al. 1995), ASCA (e.g., Kaneda et al. 1995; Tashiro et al. 1998, 2001), Chandra (e.g., Isobe et al. 2002; Croston et al. 2005; Yaji et al. 2010), XMM-Newton (e.g., Isobe et al. 2005, 2006) and Suzaku (Isobe et al. 2009, 2011a,b) indicate a dominance of the electron energy density Ue over the magnetic one UB by typically an order of magnitude in many RG lobes (see Croston et al. 2005; Isobe et al. 2009, 2011a,b), even though several lobes are also found in almost equipartition condition Ue = UB (see, e.g., discussion in Isobe et al. 2011a).
The Suzaku satellite recently measured ICS-CMB X-ray emission from a few GRG lobes (e.g. 3C 326, Isobe et al. 2009; DA240, Isobe et al. 2011a; 3C 35, Isobe et al. 2011b) and these results seem to indicate that GRG lobes have a very low particle and magnetic field energy density that would set these objects at the lower end of the UB − Ue correlation. These results strengthen the idea that the dominance of the ICS-CMB radiative losses over the synchrotron one is a common property in the lobes of GRGs (see, e.g., Ishwara-Chandra & Saikia 1999), and that RG lobes developing from a size D ≲ 100 kpc to a size D ~ Mpc induce an evolution of their energetics from the electron dominance regime (mainly in the jet) to the equipartition regime (mainly in the lobe), following the adiabatic evolution Ue ∝ D-2, in addition to a significant decrease in both Ue and UB (see the discussion in Isobe et al. 2011a).
The specific entity of these results depends, however, on a detailed knowledge of the electron spectrum over the whole range of electron energies, which is not easily obtainable from X-ray ICS-CMB observations. These are sensitive to electron Lorentz factors γ ≳ 103 (i.e. only in the high-energy branch of the electron spectrum), while most of the CMB photon Comptonization is produced in the low-energy part of the electron spectrum (see, e.g., Croston et al. 2005; Colafrancesco 2008). This is especially so for GRG lobes with steep energy spectra.
We here re-examine the derivation of the GRG lobe energetic and B-field estimates based on a detailed modeling of the multi-frequency ICS-CMB spectra and of their associated synchrotron spectra. To provide a specific and quantitative discussion, we discuss the reference case of the GRG DA 240 observed recently with Suzaku (Isobe et al. 2011a) which is the object with the steepest energy spectrum in its radio lobes among those observed with Suzaku. The GRG DA 240 is also one of the steepest spectra objects with respect to the RG sample discussed in Croston et al. (2005).
Steep energy spectra make the determination of Ue more uncertain if only X-ray observations are used, and the strong sensitivity to the value of the minimum electron energy requires a more refined analysis. That is why we explore the parameter space region allowed by the data to study the amount of variation on the electron energy density Ue. We show in Sect. 2 that the X-ray estimates of Ue provide only a rough lower limit for Ue and of the minimum energy γmin of the electron population, and we discuss the consequences of these assumptions on the RG lobe energy and radiation regime and on their multi-frequency spectral energy distributions (SEDs). We then show in Sect. 3 that observations of the SZ effect produced in GRG lobes (as originally proposed by Colafrancesco 2008) are the only ones able to provide the missing information on the total electron energy density Ue and also provide reliable estimates of the quantity Ue/UB and of the structure and evolution of GRG lobes. We discuss in Sect. 4 that similar arguments apply to other RG lobes studied in the X-ray energy band, and we discuss the various physical regimes in which RG lobes are found based on their distribution in the Ue/UB vs. Ue/UCMB plane. We summarize our results and draw our conclusions in Sect. 5.
Throughout the paper we use a flat, vacuum–dominated cosmological model with Ωm = 0.27, ΩΛ = 0.73 and H0 = 71 km s-1 Mpc-1.
2. A tale of a GRG: DA 240
The GRG DA 240 at z = 0.03561 (Rines et al. 2000) has a radius of the East lobe, in which the ICS-CMB X-ray emission has been measured by Suzaku, of ~7 arcmin (Isobe et al. 2011a), which corresponds to a linear size of 294 kpc at the GRG redshift. This is a prototype of a GRG with extended lobes that is well-suited for testing our analysis.
The radio synchrotron spectral index in the East lobe is αr = 0.95 ± 0.01 (Mack et al. 1997) in the range 326 to 609 MHz, and flattens at higher frequency, reaching a value ≈ 0.74. The radio spectrum measured between 4.8 and 10.6 GHz appears to be even flatter with αr ≈ 0.58, because the hot spot emission is likely dominant in this high-frequency range.
The X-ray ICS-CMB emission measured by Suzaku has a spectral index  compatible with the radio spectral index αr measured at low-ν between 326 and 609 MHz, but certainly steeper than the radio spectral index measured between 2.7 and 10.5 GHz (see Mack et al. 1997).
Under the assumption αX = αr, Isobe et al. (2011a) derived the X-ray ICS-CMB flux  nJy (with a best-fit reduced χ2 smaller w.r.t. the fit leaving αX as a free parameter), an overall B-field value inside the lobe of
  μG corresponding to UB ≈ (3.0 ± 0.2 ± 0.4) × 10-14 erg cm-3, and a value
  erg cm-3 integrated over the range of electron energies γ = 103−105. Here γ = E/mec2. The previous analysis done using γmin = 103 yields Ue/UB ≈ 1.1, UB/UCMB ~ 0.06 (where UCMB ≈ 4.8 × 10⁻¹³ erg cm-3 at the redshift of DA 240) and Ue/UCMB ≈ 0.07.
We stress that the previous values of the particle energy density Ue strongly depends on the assumed electron spectrum at low energy (where most of the ICS-CMB originates) and specifically on the spectral index α and on the minimum momentum p1 (or equivalently γmin) of the electron population.
We notice that the previous values of Ue and UB have been obtained by Isobe et al. (2011a) by deriving the electron density and the B-field intensity using the approximate analytical formulae given in Harris & Grindlay (1979) which are based on various assumptions: the monochromatic approximation of the ICS emission, according to which an electron with energy E emits by ICS at a single frequency that is derived by assuming a monochromatic CMB photon spectrum; the monochromatic approximation for the synchrotron emission according to which an electron with energy E in a magnetic field with intensity B emits a single frequency.
In the following we make use of the complete formulae for the synchrotron and ICS emission mechanisms (see, e.g., Schlickeiser 2002), which yield the correct results of the same order of magnitude as the approximate relations, but with some numerical difference in some specific case with respect to the approximated calculations used in Harris & Grindlay (1979).
To determine precisely Ue, we use a power-law electron spectrum to model the low-ν part of the radio spectrum  (1)where p = βγ. With this electron spectrum, the total energy density of the electron population in the RG lobe can be directly obtained (see Colafrancesco 2008; Colafrancesco et al. 2011; Enßlin & Kaiser 2000; Colafrancesco et al. 2003) as
  (2)We consider, for the sake of generality, values of the minimum electron momentum in the range p1 = 1−103. A value p1 ≈ 103 corresponds to the lower energy observable in the X-ray band, of the order of ~1 keV (see Isobe et al. 2011a), while values p1 ~ 102−103 are derived from observations of hotspots (see e.g., Carilli et al. 1991), and even lower values p1 ~ 1−10 are expected owing to the effects of adiabatic expansion of the RG lobe (see, e.g., discussion in Croston et al. 2005). Exploring a wide range of possible values for p1 is crucial for our discussion because its specific value plays a crucial role in the derivation of the actual value of Ue (see Eq. (2)). We will discuss a new observational strategy aimed at the derivation of p1 in Sect. 3 below.
The measured value of αr at low frequencies corresponds to a value of the electron spectral index α = 2.9 (here α = 2αr + 1) for the spectrum at low energies.
An electron spectrum with a break pb at low energy, with α = α1 for p < pb and α = α2 for p > pb, as produced by electron energy losses, effectively behaves for our purposes like the single power-law spectrum but with the difference that here the crucial quantity (both for the determination of Ue and for the spectral properties of the SZE) is the value of the break pb instead of p1.
We notice that the radio spectrum of the East lobe of DA 240 is dominated at high frequencies by the hot spot. For this reason, we decided to describe the hot spot emission with a single self-synchrotron Compton (SSC) model that reproduces both the high-ν radio data and the X-ray Suzaku observation at 1 keV. The X-ray spectral shape around 1 keV of the hotspot is fairly uncertain with αX in the range 0.72–1.27 (Isobe et al. 2011a; Evans et al. 2008) that allow either decreasing or increasing SED shapes in the νf(ν) − ν plot of Fig. 1. We calculated the SED of the hotspot with a single zone SSC model with parameters describing the X-ray flux by synchrotron (cyan solid) or by ICS (dashed green), because the available data do not allow usto distinguish between the two alternatives. In both cases the hotspot is not dominating the overall SED of the East lobe of DA 240 in the X-ray and gamma-ray frequency range, thus confirming the idea that most of the gamma-ray emission associated to GRG lobes comes from ICS-CMB emission from the diffuse electron population in the radio lobes (see, e.g., the recent results on the Fermi-LAT observations of the CenA lobes, Abdo et al. 2010).
We describe the total SED of the lobe as the sum of a power-law spectrum SED model for the diffuse electron population and a SSC model for the hot spot.
We discuss below the multi-frequency SED of the diffuse electron population of the East lobe of DA 240 to better constrain the shape of the electron spectrum in this radio lobe. We assume that electrons and B-field are uniformly distributed within the spherical volume of the GRG lobe with a radius equal to that of the projected area of the lobe. We normalize the ICS-CMB emission expected with the previous spectrum with p1 = 1 to the X-ray flux observed by Suzaku at 1 keV (see Isobe et al. 2011a) and we obtain k0 = 1.02 × 10⁻⁵ cm-3. This spectrum fits the synchrotron radio spectrum observed in the range 326−609 MHz (Mack et al. 1997) with a value of the magnetic field Bμ = 1.5, where Bμ is the magnetic field in μG units. The previous values of the normalization k0 and of the B-field are independent of p1 for values lower than the value of p at which electrons emit by ICS at the observed energy EX: for an observed energy EX = 1 keV one obtains a value of p ~ 685 by using the approximate relations that an electron with energy Ee emits ICS-CMB at the energy  (3)and, correspondingly, synchrotron at a frequency
  (4)This explains why the value of k0 is independent of p1 in the range p ≈ 1−102, while the situation changes for p1 ~ 103. The difference in the values of k0 and B that we obtain here for this last case and those derived by Isobe et al. (2011a) is consequently caused by the different calculations performed (see also discussion above).
The same power-law spectrum (with α = 2.9) but with a higher p1 = 103 fits the Suzaku X-ray flux at 1 keV with a normalization of k0 = 3.04 × 10⁻⁵ cm-3 and the low-ν radio spectrum with a magnetic field of Bμ = 0.87 (in agreement with the result of Isobe et al. 2011a).
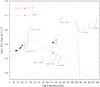 |
Fig. 1 SED of the East lobe of DA 240 calculated with a power-law spectrum recovering the low-ν radio data for p1 = 1 and Bμ = 1.5 (red solid for the radio spectrum and red dotted for the high-ν spectrum) and p1 = 103Bμ = 0.87 (magenta dashed for the high-ν spectrum). The electron spectrum has a cutoff at pcut = 5 × 10⁵ to produce an ICS-CMB gamma-ray emission below the Fermi-LAT 5-yr sensitivity limit that is exceeded for the case p1 = 103 with a power-law spectrum without high-ν cutoff. SSC SED model for the hot spot that fits the X-ray flux at 1 keV (open square point plus errorbars) with the synchrotron branch (cyan solid) or with the Compton branch (green dashed) is also shown for comparison. Various instrument sensitivities for point-like sources are shown for comparison. Instrument sensitivities are taken from the ASI-ASDC SED builder tool at http://tools.asdc.asi.it/. |
Figure 1 shows the multi-frequency SED of the East lobe of DA 240 for the two extreme values p1 = 1 and p1 = 103 to encompass the possible realistic values of this relevant parameter. The SED of DA 240 shows that the X-ray ICS-CMB emission spectrum measured by Suzaku is consistent only with the low-frequency radio data. In addition, the X-ray ICS-CMB SED for p1 = 103 has a shape that is not consistent (within the uncertainties) with the slope measured by Suzaku under the assumption of using the same radio spectral index. This is because the minimum value p1 = 103 reflects in a cutoff in the X-ray spectrum as shown in Fig. 1 (see also discussion above).
We also find that the extrapolation at high frequencies of the ICS-CMB power-law spectrum for p1 = 103 is inconsistent with the Fermi-LAT sensitivity limit, and therefore a high-E cutoff must be introduced in the electron spectrum for this case. We adopt a cutoff at pcut = 5 × 10⁵ to be consistent with the Fermi-LAT sensitivity limit, and this spectral cutoff modifies both the ICS-CMB emission SED and the shape of the radio SED. We adopt for consistency the same cutoff in the electron spectrum also for the cases with p1 = 1.
To summarize, the SED analysis of the ICS-CMB emission constrains the electron spectrum to have i) a high-E cutoff at Ee,cut ~ 255 GeV, ii) a spectral shape at low energies of α ≈ 2.9, iii) a minimum momentum p1 certainly lower than 103 but not yet determined by the available X-ray data.
We stress that X-ray ICS-CMB data provide the normalization of the electron spectrum at Ee = 0.35 GeV(EX/keV)1/2 and the spectral index of the electron spectrum in the energy range corresponding to the instrument sensitivity (ΔEe = 0.29−0.93 GeV for the Suzaku window EX = 0.7−7 keV), but these measurements are not sufficient to determine the total energy density of the electron population that depends strongly on the value of p1, which cannot be determined by typical X-ray ICS-CMB observations, as discussed in Colafrancesco (2008) and Colafrancesco et al. (2011). As a consequence, all the considerations on the ratio Ue/UB, the possible equipartition regime, and particle domination regimes are misleading and need to be revised on the basis of a more realistic estimate of the total electron energy density. This is possible by using another observational feature of the ICS-CMB emission, i.e., the SZ effect (SZE) from the RG lobe (see Colafrancesco 2008), as we discuss in the next section.
3. The SZE from the East lobe of DA 240
It has been shown (Colafrancesco 2008; see also Colafrancesco et al. 2011) that the same ICS-CMB mechanism that accounts for the X-ray emission from the lobes of GRGs also provides an SZE from GRG lobes and that its amplitude and spectral characteristics depend on the total electronic energy density of the GRG lobe. The CMB intensity change ΔIlobe(x) caused by the SZE in the lobe writes as  (5)with
  (6)(see Colafrancesco 2008), where Pe = εUe is the pressure of electrons
  (7)and v(p) is the velocity corresponding to the momentum p; we note that for a relativistic population of particles ε = 1/3 and the relation Pe = Ue/3 holds. The relativistic SZE spectral function in Eq. (5) writes
 ![\begin{equation} \tilde{g}(x)=\frac{m_{\rm e} c^2}{\langle \varepsilon_{\rm e} \rangle} \left\{ \frac{1}{\tau_{\rm e}} \left[\int_{-\infty}^{+\infty} i_0(x{\rm e}^{-s}) P(s) {\rm d}s- i_0(x)\right] \right\} , \label{eq.gdx} \end{equation}](/articles/aa/full_html/2011/11/aa17505-11/aa17505-11-eq99.png) (8)where x ≡ hν/kTCMB, in terms of the photon redistribution function P(s) and of i0(x) = I0(x)/ [2(kBTCMB)3/(hc)2] = x3/(ex − 1), where
(8)where x ≡ hν/kTCMB, in terms of the photon redistribution function P(s) and of i0(x) = I0(x)/ [2(kBTCMB)3/(hc)2] = x3/(ex − 1), where  (9)is the average energy of the electron plasma (see Colafrancesco et al. 2003). The optical depth of the electron population along the line of sight ℓ passing through the center of the lobe writes
  (10)where R is the radius of the lobe (we assume here a spherical symmetry and a uniform distribution of the electron density within the lobe as in Isobe et al. 2011a), and
  .
.
Because the amplitude and spectral shape of the GRG lobe SZE depends on the amplitude and spectral shape of the electron spectrum N(p), the SZE can be used to determine the total energy density Ue reliably, and in an unbiased way, and to assess the particle and B-field regime in which RG lobes are found.
 |
Fig. 2 Absolute value of the SZE spectrum at the center of the East lobe of DA 240 for different values of the lowest electron momentum p1 (as labelled). We adopt a value of the electron spectrum normalization k0 = 1.02 × 10⁻⁵ cm-3 as found from the normalization to the Suzaku X-ray spectrum with p1 = 1 and α = 2.9. |
The SZE spectrum expected for a population of relativistic electrons filling the East lobe of DA 240 is shown in Fig. 2 and depends sensitively on the value of p1: indeed, once the values of α and k0 are fixed from radio and X-ray observations, respectively, both the intensity and the spectral shape of the SZE (as well as the minimum, crossover and the maximum of the SZE) depend only on the specific value of p1. Figure 2 shows the absolute value of |ΔIlobe(x)| produced in the E lobe of DA 240 over a wide frequency range, up to 103 GHz, where the GRG lobe SZE spectrum is situated, and shows its main spectral characteristics: i) the negative part of the SZE spectrum from low-ν up to the crossover frequency (indicated in Fig. 2 by the dip in the spectrum located at ν ≈ 300,565,855 GHz for p1 = 1,10,100 respectively) shows a minimum (negative in sign) of its amplitude (i.e. a maximum in |ΔIlobe|) that is located at ν ≈ 150 GHz independently of p1; ii) a crossover frequency from the negative to the positive part of the spectrum that increases its frequency location for increasing values of p1; iii) a maximum (positive in sign) of the SZE amplitude whose frequency location strongly increases with increasing values of p1. Interestingly, the SZE for p1 = 103 remains always negative at all frequencies less than 103 GHz, and with a minimum amplitude of ΔI ≈ −3 × 10⁻⁷ mJy arcmin-2 (this is plotted as a maximum in the value of |ΔIlobe| in Fig. 2). For lower values of p1, the SZE spectrum shows both the negative and positive parts of the spectrum. The strong differences of the SZE spectrum therefore allow us, hence, to distinguish various values of p1 from a multi-frequency SZE analysis. This strong dependence allows us to use observations of the SZE to measure p1 from a wide-frequency (~102 ÷ 103 GHz) analysis of the SZE in GRG lobes.
The non-thermal SZE spectrum of DA 240 shown in Fig. 2 has been computed following the approach described in Colafrancesco (2008) using the spectral index α = 2.9 from low-ν radio data and the normalization k0 derived from the assumption that the X-ray flux at 1 keV from Suzaku is caused by ICS-CMB and has a spectrum consistent with α = 2.9. We note here that this is a valid approach if the value of p1 is sufficiently low to ensure a true power-law ICS-CMB X-ray spectrum for recovering the electron spectrum normalization k0 from X-ray measurements. For p1 = 103 the effect of the spectrum cutoff becomes visible at 1 keV and it is necessary to use a higher normalization of the electron spectrum to reproduce the X-ray ICS-CMB data (see Sect. 2). Observations of ICS-CMB in the hard X-ray band (with Astro-H or NuSTAR) or in the gamma-ray band (with Fermi and the future CTA in the high-energy gamma-rays, and soft gamma-ray spectrometers) would better recover the power-law spectrum indicated by the low-ν radio data and are therefore more suitable for a reliable normalization with high values of p1.
Once the value of p1 has been derived from the SZE analysis (see Colafrancesco et al. 2011, for a detailed discussion of a sample of RG lobes), the total energy density of the electron population in the RG lobe can be directly obtained using Eq. (2) (see Colafrancesco 2008; Colafrancesco et al. 2011). Table 1 shows the values of Ue derived for three GRG lobes observed with Suzaku: the East lobe of DA 240 (α = 2.9, k0 = 1.02 × 10⁻⁵ cm-3), the West lobe of 3C 326 (α = 2.6, k0 = 3.24 × 10⁻⁶ cm-3) and the lobes of 3C 35 (α = 2.4, k0 = 4.91 × 10⁻⁷ cm-3).
Values of the electron energy density Ue for DA 240 East, 3C 326 West and 3C 35.
The minimum electron momentum p1 can be directly derived from SZE observations by using Eqs. (2)−(8), with Eqs. (21), (22) from Colafrancesco (2008) for an analytical expression for Ue, which yield for steep spectrum sources, such as GRG lobes with α > 2, the equation:
![$$ {1 \over p_1^{1-\alpha}} \bigg[{1 \over 2} B_{\frac{1}{1+p_1^2}} \left(\frac{\alpha-2}{2}, \frac{3-\alpha}{2}\right) + p_1^{1 -\alpha} \left( (1+p_1^2)^{1/2} -1 \right) \bigg] = $$](/articles/aa/full_html/2011/11/aa17505-11/aa17505-11-eq142.png)
 (11)which can be inverted to obtain p1 from the observable quantities ΔIlobe,R,k0 at the frequency x.
 |
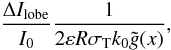
Fig. 3 ICS (red) and synchrotron (blue) timescales for electrons with energy γe. The cyan-shaded region encloses synchrotron losses for Bμ in the range 0.3–3. |
Once the parameter p1 (or equivalently γmin) is obtained, it allows us also to estimate the ICS-CMB radiative timescale of the electron population in GRG lobes that is given by  (12)and is evaluated at the minimum electron energy γmin. It turns out that τICS ≈ 2 × 10⁸ yr for γmin = 103, and it is longer for lower values of γmin (see Fig. 3). The radiative timescale τICS is always shorter than the synchrotron-loss time scale
  for all electron energies responsible for the radio emission in the 326–609 GHz range for values of Bμ fitting the radio emission, and it is also shorter than the Hubble time
  yr for γ ≳ 144. Typical spectral aging and dynamical analysis for GRGs (see, e.g., Jamrozy et al. 2005, and references therein) show that the dynamical age of GRG lobes are ≳four times the maximum synchrotron age of the emitting electrons, and hence ≳2 × 10⁸ yr (see the specific case of the GRG J1343+3758 studied by Jamrozy et al. 2005). We notice here that the spectral aging technique relies on the electron energy correspondent to the frequency of the break in the GRG radio spectrum, which is therefore a quite high electron energy (of the order of several to several tens GeV) with respect to the minimum electron energies observed in GRG radio spectra (which are of the order of a few GeV) thus yielding lower limits to the maximum radiative electron timescale. The ICS-CMB emission provides indications on even lower electron energies that hence probe larger electron radiative timescales. We conclude, therefore, that the SZE analysis of GRG lobes can provide an estimate of the maximum electron radiative timescale and hence an estimate of the lobe dynamical timescale tdyn ≈ (1 + η)τrad, with η taking values of a few, if the lobe suffers substantial inflation from backflows (see discussion in Jamrozy et al. 2005).
This argument holds for electrons with relatively high energies that satisfy τICS ≲ τH and τICS ≲ τCoul or τICS ≲ τbrem because at low energies (less than a few hundreds MeV) Coulomb losses and Bremsstrahlung losses dominate the radiative time-scales depending on the value of the ambient density (we recall the reader that τICS = γ/ [1.37 × 10⁻²⁰γ2(1 + z)4] s,  s, τbrem = γ/ { 1.51 × 10⁻¹⁶neγ [lnγ + 0.36] } s and τCoul = γ/ { 1.2 × 10⁻¹²ne { 1.0 + [ln(γ/ne)] /75 } } s, where ne is the number density of the ambient thermal electrons; see, e.g., Colafrancesco et al. 2006; see also Longair 1993; Sarazin 1999).
The presence of a substantial thermal electron population provides a possible complication to the previous picture because of the presence of a fraction of thermal electrons that are heated by the processes that accelerate the majority of non-thermal electrons. In this case, a thermal SZE is produced in addition (or alternatively if the acceleration mechanism is inefficient) to the non-thermal relativistic SZE discussed above (see also discussion in Yamada et al. 2010). To discuss this possible option, we show in Fig. 4 the thermal and non-thermal SZE generated from the E lobe of DA 240. The non-thermal SZE is shown for the electron spectrum as in Fig. 2 and for the two values of p1 = 1 and 5. The possible thermal SZE in the lobe was computed for two values of the thermal electron temperature of kT = 2 and 5 keV and assuming a reference density ne = 10-4 cm-3 of the thermal particles in the lobe.
Again a multi-frequency analysis of the SZE signals (but with a higher precision of the observations, see Colafrancesco & Marchegiani 2010, for a quantitative discussion) over a wide frequency range is able to distinguish the two sources of the SZE and consequently the two electron populations.
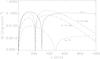 |
Fig. 4 Non-thermal SZE in a GRG lobe such as the E lobe of DA 240 is shown for two values of p1 = 1,5 (solid and dashed lines, respectively) and is compared with the thermal SZE in the same environment for two values of the thermal electron temperature kT = 2,5 keV and a reference density ne = 10-4 cm-3 (three dots-dashed and dot-dashed lines, respectively). We note that the lines corresponding to the non-thermal SZE are the same as those plotted in Fig. 2. |
4. Other RG lobes
The GRG DA 240 is only a representative case of an increasing database of GRGs with lobes studied through ICS-CMB emission. Studies of the energetics of GRG lobes through X-ray ICS-CMB observations become statistically relevant with the advent of Chandra, XMM and Suzaku. To widen our discussion, we compare in this section our findings for DA 240 with another two GRGs observed with Suzaku (see Table 1) and with the sample of FR II RG lobes studied in X-rays by Croston et al. (2005). For all these objects, information on Ue and UB are available from the combination of radio and X-ray data.
Figure 5 shows the position of the three GRG lobes DA 240E, 3C 326W and 3C 35 in the Ue − UB plane. We find that GRG lobes are likely away from equipartition for any value p1 < 103 and that their energy density is largely particle-dominated. The RG lobes analyzed by Croston et al. (2005) under the assumption p1 = 10 and a constant power-law index α = 2 for all the RG lobes also indicate Ue/UB ~ 10−102 when accurate X-ray spectra are obtained (filled green dots in Fig. 5). The other RG lobes with an X-ray detection but without reliable spectra (a necessary information to fully characterize the ICS-CMB emission) are subject to strong uncertainties in determining the nature of their X-ray emission (see, e.g., discussion in Croston et al. 2005). Indeed, their distribution in the UB − Ue plane is very sparse and uncertain, with the lobes distributed over very different physical regimes from below-equipartition condition (Ue < UB) to a regime of strong particle dominance (Ue ≳ (10−100)UB).
The shape of the correlation between Ue and UB for RG lobes depends, as we already discussed, on the specific value of p1 for each RG lobe, and it can show if GRGs are systematically different from normal RGs in their energetics and therefore in their lower energy spectrum cutoff.
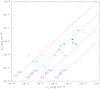 |
Fig. 5 Trajectory of the RG lobe DA240 in the Ue − UB plane calculated with Bμ = 1.5 (which fits the radio spectrum with p1 = 1) for decreasing values of p1 = 103 − 1 (from left to right) is shown by the red open circles. The results of Isobe et al. (2009, 2011a,b) for the GRGs DA240E, 3C 35 and 3C 326W assuming p1 = 103 are shown by the cyan dots. RG lobes from the analysis of Croston et al. (2005) obtained assuming α = 2 and p1 = 10 for all lobes are also shown as green dots: filled dots refer to lobes with reliable X-ray spectral estimates. Note these last data are not directly comparable to those of Isobe et al. (2009, 2011a,b) for GRGs. |
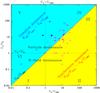 |
Fig. 6 Trajectory of the GRG lobes of DA240 (open blue circles), in the Ue/UB vs. Ue/UCMB plane is shown for decreasing values of p1 from 103 to 1 as in Table 1. The positions of DA 240 (filled blue circle), 3C 35 (blue filled square) and 3C 326 (blue filled triangles) for p1 = 10 are also shown. The shaded areas show the regions of Compton (radiation) dominance (PICS > Psynch or UB < UCMB: cyan) and synchrotron (B-field) dominance (PICS < Psynch or UB > UCMB: yellow) for the single particle limit. The equipartition lines Ue = UB, Ue = UCMB and UB = UCMB are also shown for comparison. The magenta dots show the RG lobes analyzed by Croston et al. (2005) assuming p1 = 10 and α = 2: filled magenta dots refer to lobes with reliable X-ray spectral estimates (see text for discussion). |
To further discuss the point, we also show in Fig. 6 the trajectory of DA 240 in the Ue/UB vs. Ue/UCMB plane for values p1 = 1,10,102,103 and the location of 3C 35 and 3C 326 for p1 = 10 to compare these objects with the RG lobes analyzed by Croston et al. (2005) under the same assumptions (i.e., p1 = 10).
The plot of Fig. 6 is useful to determine the physical conditions of each RG lobe. The different sectors in this plane (see Table 2) specify whether a RG lobe is particle- or radiation-dominated, Compton- or synchrotron-dominated and in which equipartition regime among Ue,UB,UCMB they are found. Table 2 describes synthetically the different physical regimes for the considered lobes in the Ue/UB vs. Ue/UCMB plane.
The GRG lobes of DA 240, 3C 326 and 3C 35 seem to be completely particle-dominated and in the Compton power dominance regime in which their total power is dominated by the ICS-CMB emission (UB < UCMB and (dE/dt)ICS > (dE/dt)syn) off the electron population residing in their lobe.
To demonstrate the predictive power of our analysis, we notice that all of the Croston et al. (2005) RG lobes with good X-ray spectra are also particle-dominated and Compton-power-dominated except one, i.e., 3C 265W: this last lobe has, in fact, the highest value of the magnetic field Bμ = 13. It has also been suggested that the ICS nuclear scattering emission might substantially contribute to its X-ray flux (see, e.g., Bondi et al. 2004; Croston et al. 2005), which would yield larger uncertainties on the nature of the X-ray emission and possibly overestimate artificially the value of Ue/UCMB. If we take the value of Ue/UB for 3C 265W at face value however, we should conclude that it is both particle-dominated (Ue > UB) and synchrotron-dominated UB > UCMB because of the quite high value of Bμ = 13, which does not make this lobe a clean representative of the ICS-CMB-dominated system.
The extreme case of the 3C 280 lobe is found to be B-field- and synchrotron-dominated (lower-right quadrant II in Fig. 6) and it has the lowest value of Ue/UB = 0.2. This RG lobe suffers from a lack of definite spectral measurement at X-rays which, however, does not allow us to determine the nature of its X-ray emission. The difficulty of separating the different components of the X-ray emission in RG lobes correctly led to discrepant results in the literature (Croston et al. 2005). In this respect it is extremely unlikely that any flux measurements are underestimates of the lobe ICS-CMB emission, so that any systematic uncertainty in the value of Ue/UB and Ue/UCMB is more likely to be an overestimation.
Our analysis of RG lobes reported in Fig. 6 indicates that all GRG lobes with definite ICS-CMB spectral measurements are particle-dominated and ICS-CMB-power-dominated. The other RG lobes have X-ray spectral measurements that are likely contaminated by nuclear or hot-spot X-ray emission.
We propose here to use the Ue/UB − Ue/UCMB plot to characterize the physical regime of RG lobes better, and we will present a more extensive analysis of RG lobe multi-frequency emission elsewhere (Colafrancesco et al., in prep.).
The condition Ue/UB ~ 10−100 suggested by the GRG lobe data (see Figs. 5 and 6) indicates a substantial amount of electrons with energies above γmin ≳ 10 and up to γmax ~ 105−106 which seems to be required to explain the radio, mm, X-ray and (in a few observed cases) also the gamma-ray observations (see, e.g., Massaro & Ajello 2011, and references therein). This relatively energetic electron population spread over the GRG lobes could be sustained by turbulent acceleration mechanisms and diffusion in a filamentary B-field configuration (see Gopal-Krishna et al. 2001) that seems to be efficient in balancing their radiative energy losses along the late stage of the GRG lobe evolution.
More effective and definitive observations are required to probe the total energy density of RG lobes however. The results reported here demonstrate that SZE measurements are crucial to establish in an unbiased way the realistic estimates of Ue and hence the correlation between Ue and UB for RG lobes.
5. Summary and conclusions
We have shown that the electron energy density Ue in GRG lobes derived from X-ray observations is only a rough lower limit to the actual value of Ue if p1 is substantially less than 103, as indicated by observations and theoretical expectations. This result is even stronger for larger spectral indices α, as those shown by GRG lobes. This indicates that – even though X-ray measurements are relevant to set the electron spectrum normalization at high-Ee – the properties of the low-energy electron population in the radio lobes are poorly constrained by X-ray measurements that probe electrons with Ee ~ 0.1−1 GeV (for EX ~ 0.1−10 keV), which is particularly problematic when studying the overall power of the ICS-CMB process. Moreover this leads us to reconsider the physical regimes in which GRG lobes are found.
We have shown that all RG lobes with reliable ICS-CMB spectral measurements in the X-ray band are in a regime of radiative Compton dominance and particle domination with respect to the B-field energy density. Therefore RG lobes are likely expected to have Ue/UB ≳ 10−100 and Ue/UCMB ≳ 1−20, which indicates that they have a population of relatively energetic electrons providing a substantial energy and pressure support to the lobes, consistent with a turbulent MHD acceleration origin. Under this regime, we predict that many other RG lobes will be visible with the next-generation hard X-ray (Astro-H, NuSTAR) and some also with gamma-ray (CTA and the next-generation soft gamma-ray spectrometer) instruments. The importance of the future hard X-ray and gamma-ray observation is their ability to set the electron spectrum normalization, even though they cannot definitely assess the value of the total Ue. We have shown that the SZE visible in the direction on many of these GRG lobes with the next coming microwave and mm spectroscopic experiments (see discussion in Colafrancesco & Marchegiani 2010; and Colafrancesco et al. 2011) ensures the capability of determinig the total value of Ue because the SZE is sensitive to the overall energy spectrum extension and in particular to the minimum energies of the electron population.
A final point we stress is that the determination of the RG lobe B-field from radio and X-ray observations implies the assumption of a model for the electron spectrum (as also pointed out in Croston et al. 2005). In fact, electrons that emit in the radio (by synchrotron) and in the X-rays (by ICS-CMB) are not identical except for a specific choice of the B-field. For the DA 240 East lobe, an X-ray observation at 1 keV implies that these electrons have an energy of Ee ~ 0.35 GeV, and that the same electrons emit synchrotron at a frequency ν ~ 2Bμ MHz with Bμ = 1.5 ÷ 0.87 for p1 = 1−103, respectively. Electrons that emit synchrotron in the observed range (ν = 326 ÷ 609 MHz) have energies 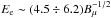 GeV, and emit by ICS-CMB in the range
 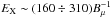 keV. The assumption of using the same electron spectrum in the two electron energy ranges is likely reasonable only if the radio and X-ray spectral indices are compatible within the uncertainties.
Future studies of RG lobes with high-sensitivity radio experiments (like SKA and its precursors, MeerKAT in South Africa and ASKAP in Australia) will be able to measure the electron spectrum and the magnetic field with high precision and spatial resolution from observation over a wide frequency range ~0.1−45 GHz, and their high-ν bands at ≳ 30 GHz will also be able to measure simultaneously the radio and SZE spectrum at low frequencies, while mm experiments (e.g. Planck, OLIMPO, HERSCHEL, ALMA) will be able to fully measure the SZE spectrum and the RG lobe energetics. In this context, hard X-rays (NuSTAR, Astro-H) and gamma-rays (Fermi, CTA) will be crucial for determining the high-E spectrum normalization and for indicating on the high-E energy cutoff. The recent observations on Centaurus A with the Fermi-LAT instrument (Abdo et al. 2010) and of Fornax-A with Suzaku (Tashiro et al. 2009) indicate that ICS-CMB emission dominates the GRG lobe SEDs at very high frequencies and opens the way to the determination
of their electron spectrum at the high-E tail. These observations will be crucial for exploiting the SZE observational techniques of GRG lobes.
Acknowledgments
We thank an anonymous referee for several useful comments and suggestions that allowed us to improve the discussion and the presentation of our results. S.C. acknowledges support by the South African Research Chairs Initiative of the Department of Science and Technology and National Research Foundation and by the Square Kilometre Array (SKA).
References
- Abdo, A. A., Ackermann, M., Ajello, M., et al. 2010, Science, 328, 725 [NASA ADS] [CrossRef] [PubMed] [Google Scholar]
- Bondi, M., Brunetti, G., Comastri, A., & Setti, G. 2004, MNRAS, 354, L43 [NASA ADS] [CrossRef] [Google Scholar]
- Carilli, C. L., Perley, R. A., Dreher, J. W., & Leahy, J. P. 1991, ApJ, 383, 554 [NASA ADS] [CrossRef] [Google Scholar]
- Colafrancesco, S. 2008, MNRAS, 385, 2041 [NASA ADS] [CrossRef] [Google Scholar]
- Colafrancesco, S., & Marchegiani, P. 2010, A&A, 520, A31 [NASA ADS] [CrossRef] [EDP Sciences] [Google Scholar]
- Colafrancesco, S., Marchegiani, P., & Palladino 2003, A&A, 397, 27 [NASA ADS] [CrossRef] [EDP Sciences] [Google Scholar]
- Colafrancesco, S., Profumo, S., & Ullio, P. 2006, A&A, 455, 21 [NASA ADS] [CrossRef] [EDP Sciences] [Google Scholar]
- Colafrancesco, S., Marchegiani, P., de Bernardis, P., & Masi, S. 2011, A&A, submitted [Google Scholar]
- Croston, J. H., Hardcastle, M. J., Harris, D. E., et al. 2005, ApJ, 626, 733 [NASA ADS] [CrossRef] [Google Scholar]
- Enßlin, T. A., & Kaiser, C. R. 2000, A&A, 360, 417 [NASA ADS] [Google Scholar]
- Evans, D. A., Hardcastle, M. J., Lee, J. C., et al. 2008, ApJ, 688, 844 [NASA ADS] [CrossRef] [Google Scholar]
- Feigelson, E. D., Laurent-Muehleisen, S. A., Kollgaard, R. I., & Fomalont, E. B. 1995, ApJ, 449, L149 [Google Scholar]
- Gopal-Krishna,Subramanian, P., Wiita, P. J., & Becker, P. A. 2001, A&A, 377, 827 [NASA ADS] [CrossRef] [EDP Sciences] [Google Scholar]
- Harris, D. E., & Grindlay, J. E. 1979, MNRAS, 188, 25 [NASA ADS] [Google Scholar]
- Kaneda, H., Tashiro, M., Ikebe, Y., et al. 1995, ApJ, 453, L13 [NASA ADS] [CrossRef] [Google Scholar]
- Ishwara-Chandra, C. H., & Saikia, D. J. 1999, MNRAS, 309, 100 [NASA ADS] [CrossRef] [Google Scholar]
- Isobe, N., Tashiro, M., Makishima, K., et al. 2002, ApJ, 580, L111 [NASA ADS] [CrossRef] [Google Scholar]
- Isobe, N., Makishima, K., Tashiro, M., & Hong, S. 2005, ApJ, 632, 781 [NASA ADS] [CrossRef] [Google Scholar]
- Isobe, N., Makishima, K., Tashiro, M., et al. 2006, ApJ, 645, 256 [NASA ADS] [CrossRef] [Google Scholar]
- Isobe, N., Tashiro, M. S., Gandhi, P., et al. 2009, ApJ, 706, 454 [NASA ADS] [CrossRef] [Google Scholar]
- Isobe, N., Seta, H., & Tashiro, M. S. 2011a, PASJ, accepted [arXiv:1105.3473] [Google Scholar]
- Isobe, N., Seta, H., Gandhi, P., & Tashiro, M. S. 2011b, ApJ, 727, 82 [NASA ADS] [CrossRef] [Google Scholar]
- Jamrozy, M., Machalski, J., Mack, K.-H., & Klein, U. 2005, A&A, 433, 477 [Google Scholar]
- Longair, M. 1993, High Energy Astrophysics (Cambridge: Cambridge Univ. Press) [Google Scholar]
- Mack, K.-H., Klein, U., O’Dea, C. P., & Willis, A. G. 1997, A&AS, 123, 423 [NASA ADS] [CrossRef] [EDP Sciences] [Google Scholar]
- Massaro, F., & Ajello, M. 2011, ApJ, 729, L12 [NASA ADS] [CrossRef] [Google Scholar]
- Rines, K., Geller, M. J., Diaferio, A., et al. 2000, AJ, 120, 2338 [NASA ADS] [CrossRef] [Google Scholar]
- Sarazin, C. L. 1999, ApJ, 520, 529 [NASA ADS] [CrossRef] [Google Scholar]
- Schlickeiser, R. 2002, Cosmic Ray Astrophysics (Berlin: Springer-Verlag) [Google Scholar]
- Tashiro, M., Kaneda, H., Makishima, K., et al. 1998, ApJ, 499, 713 [NASA ADS] [CrossRef] [Google Scholar]
- Tashiro, M., Isobe, N., Seta, H., Yaji, Y., & Matsuta, K. 2009, PASJ, 61, S327 [NASA ADS] [CrossRef] [Google Scholar]
- Yaji, Y., Tashiro, M. S., Isobe, N., et al. 2010, ApJ, 714, 37 [NASA ADS] [CrossRef] [Google Scholar]
- Yamada, M., Fujita, Y., Matsuo, H., & Sugiyama, N. 2010, AJ, 139, 2494 [NASA ADS] [CrossRef] [Google Scholar]
All Tables
All Figures
|
Fig. 1 SED of the East lobe of DA 240 calculated with a power-law spectrum recovering the low-ν radio data for p1 = 1 and Bμ = 1.5 (red solid for the radio spectrum and red dotted for the high-ν spectrum) and p1 = 103Bμ = 0.87 (magenta dashed for the high-ν spectrum). The electron spectrum has a cutoff at pcut = 5 × 10⁵ to produce an ICS-CMB gamma-ray emission below the Fermi-LAT 5-yr sensitivity limit that is exceeded for the case p1 = 103 with a power-law spectrum without high-ν cutoff. SSC SED model for the hot spot that fits the X-ray flux at 1 keV (open square point plus errorbars) with the synchrotron branch (cyan solid) or with the Compton branch (green dashed) is also shown for comparison. Various instrument sensitivities for point-like sources are shown for comparison. Instrument sensitivities are taken from the ASI-ASDC SED builder tool at http://tools.asdc.asi.it/. |
| In the text | |
|
Fig. 2 Absolute value of the SZE spectrum at the center of the East lobe of DA 240 for different values of the lowest electron momentum p1 (as labelled). We adopt a value of the electron spectrum normalization k0 = 1.02 × 10⁻⁵ cm-3 as found from the normalization to the Suzaku X-ray spectrum with p1 = 1 and α = 2.9. |
| In the text | |
|
Fig. 3 ICS (red) and synchrotron (blue) timescales for electrons with energy γe. The cyan-shaded region encloses synchrotron losses for Bμ in the range 0.3–3. |
| In the text | |
|
Fig. 4 Non-thermal SZE in a GRG lobe such as the E lobe of DA 240 is shown for two values of p1 = 1,5 (solid and dashed lines, respectively) and is compared with the thermal SZE in the same environment for two values of the thermal electron temperature kT = 2,5 keV and a reference density ne = 10-4 cm-3 (three dots-dashed and dot-dashed lines, respectively). We note that the lines corresponding to the non-thermal SZE are the same as those plotted in Fig. 2. |
| In the text | |
|
Fig. 5 Trajectory of the RG lobe DA240 in the Ue − UB plane calculated with Bμ = 1.5 (which fits the radio spectrum with p1 = 1) for decreasing values of p1 = 103 − 1 (from left to right) is shown by the red open circles. The results of Isobe et al. (2009, 2011a,b) for the GRGs DA240E, 3C 35 and 3C 326W assuming p1 = 103 are shown by the cyan dots. RG lobes from the analysis of Croston et al. (2005) obtained assuming α = 2 and p1 = 10 for all lobes are also shown as green dots: filled dots refer to lobes with reliable X-ray spectral estimates. Note these last data are not directly comparable to those of Isobe et al. (2009, 2011a,b) for GRGs. |
| In the text | |
|
Fig. 6 Trajectory of the GRG lobes of DA240 (open blue circles), in the Ue/UB vs. Ue/UCMB plane is shown for decreasing values of p1 from 103 to 1 as in Table 1. The positions of DA 240 (filled blue circle), 3C 35 (blue filled square) and 3C 326 (blue filled triangles) for p1 = 10 are also shown. The shaded areas show the regions of Compton (radiation) dominance (PICS > Psynch or UB < UCMB: cyan) and synchrotron (B-field) dominance (PICS < Psynch or UB > UCMB: yellow) for the single particle limit. The equipartition lines Ue = UB, Ue = UCMB and UB = UCMB are also shown for comparison. The magenta dots show the RG lobes analyzed by Croston et al. (2005) assuming p1 = 10 and α = 2: filled magenta dots refer to lobes with reliable X-ray spectral estimates (see text for discussion). |
| In the text | |
Current usage metrics show cumulative count of Article Views (full-text article views including HTML views, PDF and ePub downloads, according to the available data) and Abstracts Views on Vision4Press platform.
Data correspond to usage on the plateform after 2015. The current usage metrics is available 48-96 hours after online publication and is updated daily on week days.
Initial download of the metrics may take a while.