Fig. 6
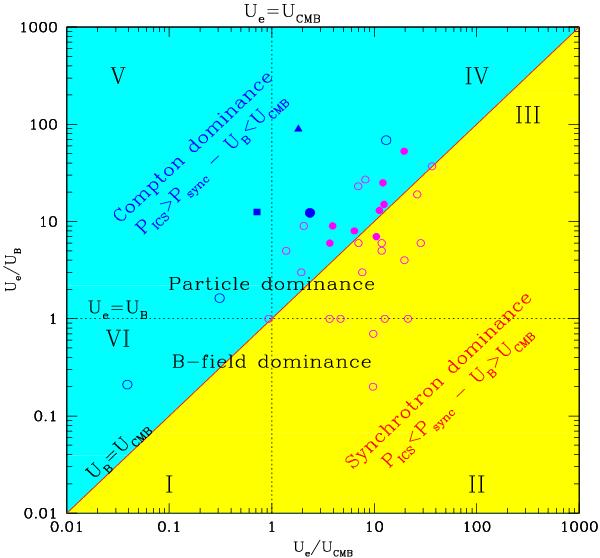
Trajectory of the GRG lobes of DA240 (open blue circles), in the Ue/UB vs. Ue/UCMB plane is shown for decreasing values of p1 from 103 to 1 as in Table 1. The positions of DA 240 (filled blue circle), 3C 35 (blue filled square) and 3C 326 (blue filled triangles) for p1 = 10 are also shown. The shaded areas show the regions of Compton (radiation) dominance (PICS > Psynch or UB < UCMB: cyan) and synchrotron (B-field) dominance (PICS < Psynch or UB > UCMB: yellow) for the single particle limit. The equipartition lines Ue = UB, Ue = UCMB and UB = UCMB are also shown for comparison. The magenta dots show the RG lobes analyzed by Croston et al. (2005) assuming p1 = 10 and α = 2: filled magenta dots refer to lobes with reliable X-ray spectral estimates (see text for discussion).
Current usage metrics show cumulative count of Article Views (full-text article views including HTML views, PDF and ePub downloads, according to the available data) and Abstracts Views on Vision4Press platform.
Data correspond to usage on the plateform after 2015. The current usage metrics is available 48-96 hours after online publication and is updated daily on week days.
Initial download of the metrics may take a while.