Fig. 5
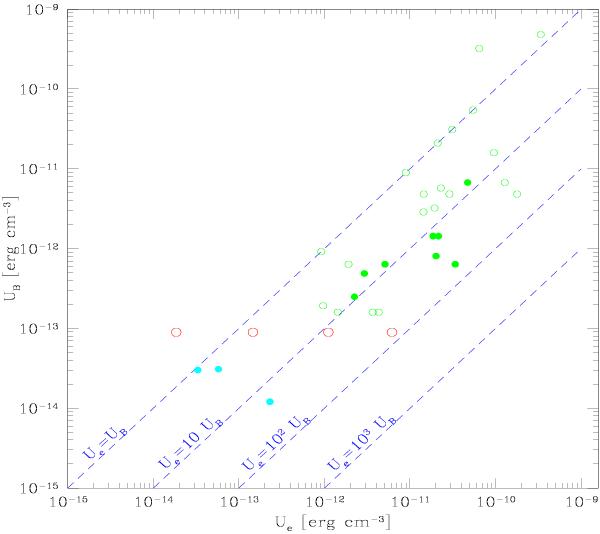
Trajectory of the RG lobe DA240 in the Ue − UB plane calculated with Bμ = 1.5 (which fits the radio spectrum with p1 = 1) for decreasing values of p1 = 103 − 1 (from left to right) is shown by the red open circles. The results of Isobe et al. (2009, 2011a,b) for the GRGs DA240E, 3C 35 and 3C 326W assuming p1 = 103 are shown by the cyan dots. RG lobes from the analysis of Croston et al. (2005) obtained assuming α = 2 and p1 = 10 for all lobes are also shown as green dots: filled dots refer to lobes with reliable X-ray spectral estimates. Note these last data are not directly comparable to those of Isobe et al. (2009, 2011a,b) for GRGs.
Current usage metrics show cumulative count of Article Views (full-text article views including HTML views, PDF and ePub downloads, according to the available data) and Abstracts Views on Vision4Press platform.
Data correspond to usage on the plateform after 2015. The current usage metrics is available 48-96 hours after online publication and is updated daily on week days.
Initial download of the metrics may take a while.