Fig. 4
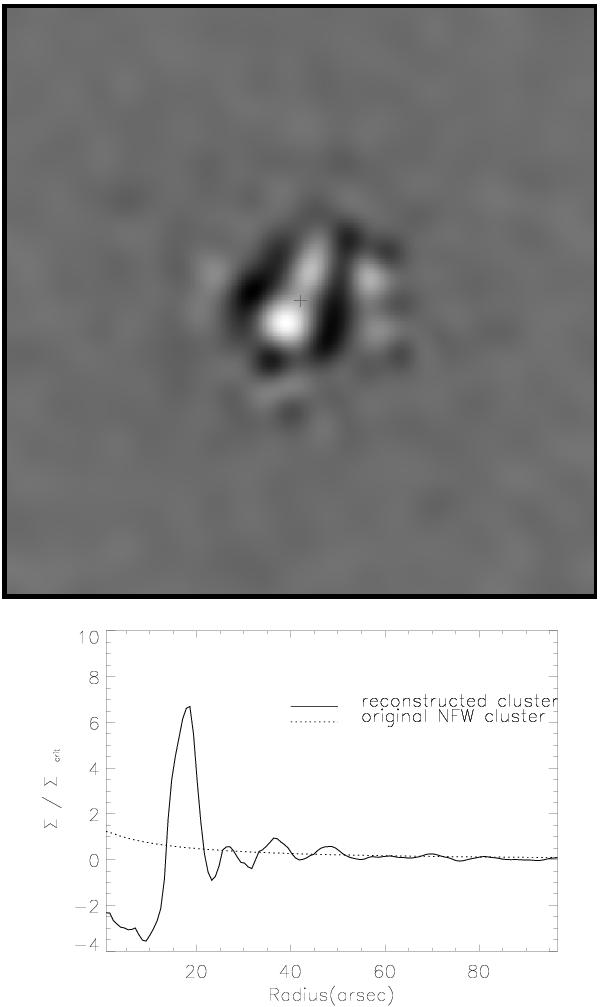
Plots for M3.3′ = 4.34 × 10¹⁴ M⊙ and M30′′ ≈ 1.9 × 10¹⁴ M⊙. Overfitting case. It shows the solution obtained with the BGA when the method is forced to find a nearly exact solution to the problem (ϵ = 2 × 10-15). The density profile inside the core radius does not follow the profile of the input NFW cluster. Different density peaks and dips can be seen around the center of the FOV. Darker areas correspond to higher masses.
Current usage metrics show cumulative count of Article Views (full-text article views including HTML views, PDF and ePub downloads, according to the available data) and Abstracts Views on Vision4Press platform.
Data correspond to usage on the plateform after 2015. The current usage metrics is available 48-96 hours after online publication and is updated daily on week days.
Initial download of the metrics may take a while.