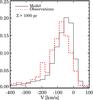
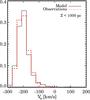
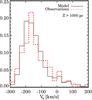
Fig. 10
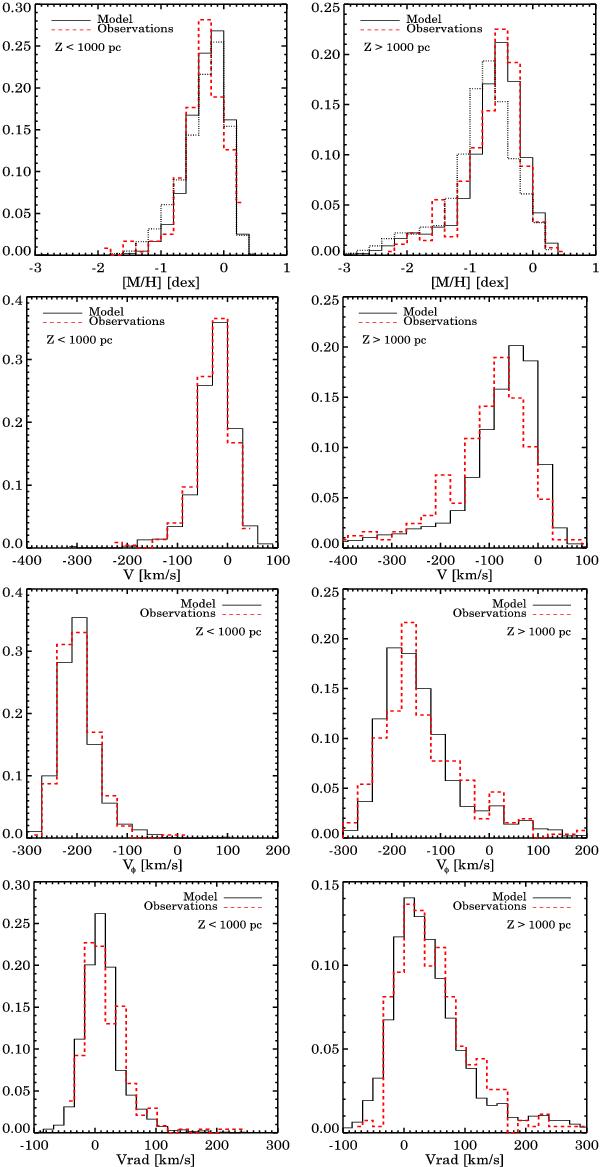
Comparisons between our observations (red dashed histograms) and the Besançon model predictions (black solid histograms) for the metallicities, rotational (V in Cartesian and Vφ in cylindrical coordinates system) and radial velocities. The left-side plots include the stars that are lower than 1 kpc, whereas the right-side plots include the stars farther than 1 kpc from the plane. Dotted black histogram corresponds to the raw Besançon model (as downloaded from the web, but biased to match our magnitude distribution), whereas the black continuous line corresponds to a model with a richer by 0.3 and 0.2 dex thick disc and halo, respectively.
Current usage metrics show cumulative count of Article Views (full-text article views including HTML views, PDF and ePub downloads, according to the available data) and Abstracts Views on Vision4Press platform.
Data correspond to usage on the plateform after 2015. The current usage metrics is available 48-96 hours after online publication and is updated daily on week days.
Initial download of the metrics may take a while.