Fig. 8
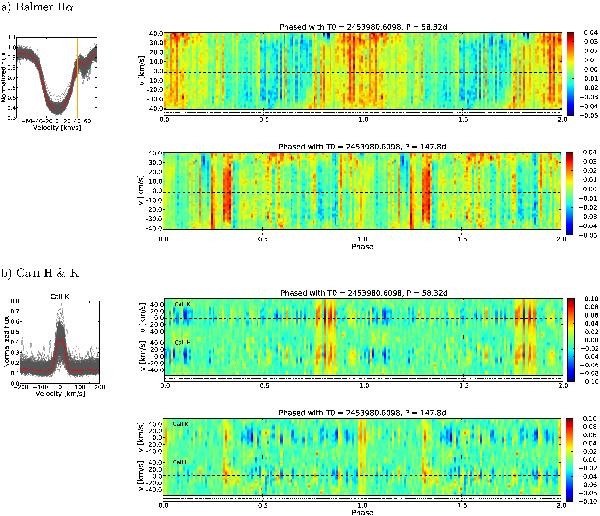
Modulation of chromospheric activity tracers during the years 2007–2010. The two top rows show Hαa), the two bottom rows show Ca ii H&K (b). The left panels are overplots of all line profiles for 2007–2010 (in panel b) only the K-line is shown), while the bright lines indicate the median profiles, respectively. The right hand panels are the dynamic spectra phased with the photometric rotational period (top) and the orbital period (bottom) and the zero points from Table 2. The color scale indicates the relative emission-line flux with respect to the median profile. The two dashed, horizontal lines show ± vsini, and the chain of points in the very bottom of the graphs represents the phase coverage (one dot is one spectrum). It appears that both activity tracers display a clear modulation with the rotational period, with a tendency to cluster around a time of periastron at phase 1.0, and maintained that behavior for the entire duration of our observations.
Current usage metrics show cumulative count of Article Views (full-text article views including HTML views, PDF and ePub downloads, according to the available data) and Abstracts Views on Vision4Press platform.
Data correspond to usage on the plateform after 2015. The current usage metrics is available 48-96 hours after online publication and is updated daily on week days.
Initial download of the metrics may take a while.