Fig. 13
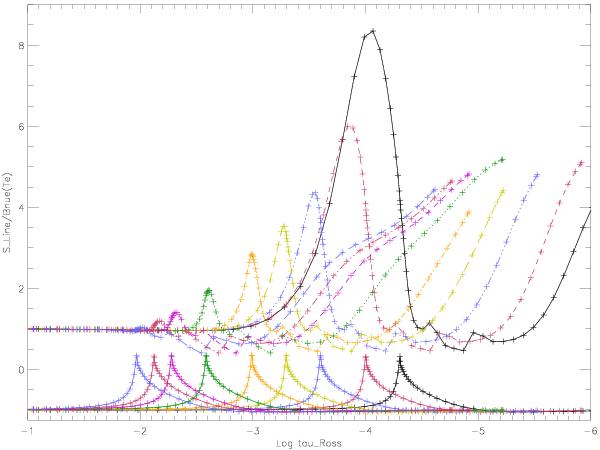
Line source function of Brα (in units of the local Planck function) and velocity gradient (vertically scaled) as a function of τRoss, for the same Ṁ-sequence as in Fig. 12. Note that the transition region between photosphere and wind moves towards lower τRoss for decreasing Ṁ, i.e., the model with the lowest mass-loss is located at the right of the figure.
Current usage metrics show cumulative count of Article Views (full-text article views including HTML views, PDF and ePub downloads, according to the available data) and Abstracts Views on Vision4Press platform.
Data correspond to usage on the plateform after 2015. The current usage metrics is available 48-96 hours after online publication and is updated daily on week days.
Initial download of the metrics may take a while.