| Issue |
A&A
Volume 535, November 2011
|
|
|---|---|---|
| Article Number | A54 | |
| Number of page(s) | 8 | |
| Section | Planets and planetary systems | |
| DOI | https://doi.org/10.1051/0004-6361/200913580 | |
| Published online | 04 November 2011 | |
The HARPS search for southern extra-solar planets
XXIX. Four new planets in orbit around the moderatly active dwarfs HD 63765, HD 104067, HD 125595, and HIP 70849⋆,⋆⋆
1
Observatoire Astronomique de l’Université de Genève,
51 ch. des Maillettes – Sauverny,
1290
Versoix,
Switzerland
e-mail: Damien.Segransan@unige.ch
2
Physikalisches Institut, Universitat Bern,
Silderstrasse 5, 3012
Bern,
Switzerland
3
Institut d’Astrophysique de Paris, UMR 7095 CNRS, Université
Pierre & Marie Curie, 98bis
boulevard Arago, 75014
Paris,
France
4
Observatoire de Haute-Provence, 04870 Saint-Michel l’ Observatoire,
France
5
Max-Planck-Institut für Astronomie, Königstuhl 17, 69117
Heidelberg,
Germany
6
Laboratoire d’Astrophysique de Marseille, UMR 6110 CNRS,
Université de Provence, 38 rue
Frédéric Joliot-Curie, 13388
Marseille Cedex 13,
France
7
European Southern Observatory, Karl-Schwarzschild-Str. 2, 85748
Garching bei München,
Germany
8
Centro de Astrofísica, Universidade do Porto,
Rua das Estrelas, 4150-762
Porto,
Portugal
Received:
2
November
2009
Accepted:
29
March
2011
We report the detection of four new extrasolar planets in orbit around the moderately active stars HD 63765, HD 104067, HIP 70849, and HD 125595 with the HARPS Echelle spectrograph mounted on the ESO 3.6-m telescope at La Silla. The first planet, HD 63765 b, has a minimum mass of 0.64 MJup, a period of 358 days, and an eccentricity of 0.24. It orbits a G9 dwarf at 0.94 AU. The second planet, HD 104067 b, is a 3.6 Neptune-mass-planet with a 55.8-day-period. It orbits its parent K2 dwarf, in a circular orbit with a semi-major axis of a = 0.26 AU. Radial velocity measurements present a ≈ 500-day-oscillation that reveals significant magnetic cycles. The third planet is a 0.77 Neptune-mass-planet in circular orbit around the K4 dwarf, HD 12595, with a 9.67-day-period. Finally, HIP 7849 b is a long-period (5 < P < 75 years) and massive planet of m sin i ≈ 3.5−15 MJup that orbits a late K7 dwarf.
Key words: techniques: radial velocities / planetary systems / stars: individual: HD 63765 / stars: individual: HD 104067 / stars: individual: HD 125595 / stars: individual: HIP 70849
The HARPS radial velocity measurements discussed in this paper are only available at the CDS via anonymous ftp to cdsarc.u-strasbg.fr (130.79.128.5) or via http://cdsarc.u-strasbg.fr/viz-bin/qcat?J/A+A/535/A54
© ESO, 2011
1. Introduction
The HARPS planet-search program has been going on for 6 years (since 2003) at the 3.6-m ESO telescope located at La Silla Observatory, Chile (Pepe et al. 2000; Mayor et al. 2003). Both HD 63765 and HD 104067 were part of the high-precision subprogram of the HARPS guaranted time observions (GTO), which aimed at detecting very low-mass planets in a sample of solar-type stars already screened for giant planets at a lower precision with CORALIE Echelle spectrograph mounted on the 1.2-m Swiss telescope on the same site (Udry et al. 2000). HIP 70849 and HD 125595, on the other hand, are part of the HARPS volume-limited sample program of the HARPS GTO. The sample is composed of about 1200 stars within 57.5 pc, among which 850 G, K dwarfs that are known as single stars with low activity and low vsini. The goal of this program was to monitor the 850 stars at the 3 ms-1 precision level to detect all the gas giants present in this statistically robust sample. Observed distributions of planets’ orbital elements and masses, as well as host star characteristics should then be compared to theoretical predictions to improve our knowledge of planet formation and evolution.
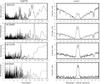 |
Fig. 1 Left: chromospheric activity index periodogram for HD 63765, HD 104067, HD 125595, and HIP 70849. Right: Ca II H emission region. The large re-emission at the bottom of the Ca II H absorption line at λ = 3933.66 is an indicator of chromospheric activity. |
So far, HARPS has allowed the detection (or has contributed to the detection) of more than 85 extrasolar planet candidates (the latest batch of which was presented in a series of parallel papers e.g. Forveille et al. 2011; Lovis et al. 2011; Mordasini et al. 2011; Moutou et al. 2011; Lo Curto et al. 2010; Naef et al. 2010) among the ≈ 460 known today. But more specifically, HARPS is unveiling the tip of the iceberg of the very low-mass planet population (see Lovis et al. 2009; Mayor et al. 2009), which when combined with forthcoming results allow extrapolating results of their mass distribution. Lovis et al. (2009) show that ≈ 30% of the stars surveyed in the HARPS high precision program have planets with masses below 30-earth masses on periods shorter than 50 days. Furthemore, ≈ 80% of those planets are in multplanetary systems. HARPS’ high stability not only gives access to super-Earth’s at short periods but is also sensitive to Neptune-mass-planets at a longer period, (e.g., HD 69830 b, Lovis et al. 2006). The discovery of those intermediate-mass planets (1 − 10 MNept) in the 0.1 to 0.5 AU separation range is of interest for planetary formation scenarios since those planets are hardly formed according to Ida & Lin (2005) or at least, should be rare according to Mordasini et al. (2009).
In this paper we report the detection of four planets orbiting moderately active stars. Two of them are Neptunian planets at relatively short periods orbiting HD 104067 and HD 125595. The other two are gas giants at longer periods in orbit around HD 63765 and HIP 70849. The paper is organized as follows. In the first section we briefly discuss the primary-star properties. Data analysis is presented in Sect. 3.1 while radial-velocity measurements and orbital solutions are discussed in Sect. 3. In Sect. 4, we provide concluding remarks.
2. Stellar characteristics
The effective temperatures, gravity, and metallicities were derived from the spectroscopic analysis of the HARPS targets as described in Sousa et al. (2008). We used the improved Hipparcos astrometric parallaxes rederived by van Leeuwen (2007) to determine the absolute V-band magnitude using the apparent visual magnitude from Hipparcos (ESA 1997). Metallicities, together with the effective temperatures and MV were then used to estimate basic stellar parameters (ages, masses) bases on theoretical isochrones from Girardi et al. (2000) and a Bayesian estimation method described in da Silva et al. (2006)1. Individual spectra were also used to derive both the bisector inverse slope (BIS) of the HARPS cross-correlation function (CCF), as defined by Queloz et al. (2000), as well as a measurement of the chromospheric activity index  , following a similar recipe as used by Santos et al. (2000) for CORALIE spectra. Using the Noyes et al. (1984) empirical calibration of the rotational period vs. activity, we estimated rotational periods. We also derived the vsin(i) from the HARPS spectra following the Santos et al. (2002) approach. The HIP 70849 spectral type is, however, too late (K7V) to carry out Sousa et al. (2008) analysis. For such a low-mass star, we have to rely on near-infrared photometric measurements, as well as on accurate mass-luminosity relations (Baraffe et al. 1998; Delfosse et al. 2000), to derive its fundamental physical parameters. The list of all stellar parameters can be found in Table 1.
The four stars have activity indexes, , ranging between − 4.69 and − 4.80, and they show a large Ca II re-emission at λ = 3933.66 (see Fig. 1), revealing significant chromospheric activity possibly induced by stellar spots or plagues. In addition, indexes display variability on different time-scales as observed on their periodograms (see Fig. 1). Short time-scale variation can often be matched to the rotation period of the star (such as for HD 63765 and HD 125595), while longer time scale variability in the chromospheric activity index could betray the existence of stellar magnetic cycles (such as for HD 63765, HD 104067 and HD 125595). HIP 70849 does not display any significant variabilitiy in the index.
For some stars, a linear correlation between the activity index and the radial velocities is observed (see Fig. 3), leading the way to possible stellar activity detrending around moderately active stars. However, this topic is beyond the scope of this paper so we decided, instead, to estimate the overall stellar radial velocity jitter. To do so, we measured the radial velocity dispersion on a sample of stars with similar and spectral type that show no planetary. For each star, a radial velocity jitter of a few ms-1 was derived (see Table 1), which was used as an external white noise in the planet search algorithm (see Sect. 3.1).
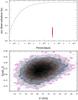 |
Fig. 2 Top: genetic algorithm population at the end of evolution represented in a period-eccentricity diagram. The dark curve is the maximum eccentricity a planet can reach without colliding the star. Bottom: joint probability density function of the radial velocity semi-amplitude and the eccentricity. The red, blue and cyan contour represent the 1 − 3σ confidence intervals of the joint PDF. |
3. Radial-velocity measurements and orbital solutions
3.1. A Bayesian genetic algorithm with Markof chains
Since 2003, we have been developing and using a genetic algorithm to retrieve multiple Keplerian orbital solutions (Ségransan et al., in prep.). The main advantage of genetic algorithm compared to other advanced methods such as “Markov chain Monte Carlo” (hereafter MCMC) with parallel tempering (for illustration see Gregory 2007) is that it allows probing the full model parameters space in a extremely efficient way (solutions of complex planetary systems solutions are derived in a few minutes instead of hours to run MCMC from scratch on a MacBook Pro). However, the population at the end of the evolution is not statistically reliable owing the intrinsic nature of genetic algorithm based of genome crossover and mutation. We therefore added a MCMC module with Metropolis hasting to overcome this problem. The algorithm is based on the formalism described in Collier Cameron et al. (2007) with several thousands chains drawn from the final genetic algorithm’s population. Each chain runs several thousand times to retrieve a statistically reliable population. For poorly constrained planetary systems, the Bayesian formalism described in Gregory (2007) is used. A full overview of the algorithm will be described in a forthcoming paper (Ségransan et al., in prep.).
3.2. A one-year period Jovian planet around HD 63765
HD 63765 was part of the CORALIE planet search survey (Udry et al. 2000) before being monitored at higher precision with HARPS. Since March 2000, 56 measurements have been acquired with CORALIE with a typical signal-to-noise ratio of 46 (per pixel at 550 nm) and a mean measurement uncertainty (including photon noise and calibration errors) of 4.5 ms-1. In June 2007, we upgraded the instrument that slightly changes its zero point (Ségransan et al. 2010). We therefore adjusted an instrumental offset between the measurements taken before and after June 2007 (namely CORALIE-98 and CORALIE-07). Since December 2003, we have recorded a total of 52 measurements with HARPS with a better signal-to-noise (SNR ≈ 155) than CORALIE as well as a better final accuracy (60 cm-1, including photon noise and calibration errors). Despite the lower accuracy of the CORALIE spectrograph, we decided to include the CORALIE data because of their longer time span, mainly to increase the accuracy on the orbital period of the planet. Altogether, 108 radial velocities were gathered. A stellar velocity jitter of 3.0 ms-1 was quadratically added to the mean radial velocity uncertainty. A single-planet Keplerian model was adjusted to the data and produced residuals that show a level of variation σ = 3.41 ms-1, yielding a reduced χ2 of 1.30. Figure 3 shows the HARPS radial velocities and the corresponding best-fit Keplerian model. The resulting orbital parameters for the first planet are P = 358 days, e = 0.24 and K = 20.9 ms-1, implying a minimum mass msin(i) = 0.64 MJup and a semi-major axis a = 0.940 AU. Despite its proximity to one year, we are confident that the 358-day period is the correct one. Indeed, the genetic algorithm does not display any other significant solution in a period-eccentricity diagram (see Fig. 2). This is reasonably explained by the large radial-velocity amplitude (K = 20.9 ms-1) compared to the residual noise (σ = 3.41 ms-1) and the fact that 75% of the orbital phase is covered (see Fig. 3). In addition, the mcmc analysis shows that the probability distribution functions (hereafter PDF) of all parameters are gaussian with no obvious correlations between them as illustrated by the semi-amplitude vs. eccentricity diagram (see Fig. 2). Orbital elements for HD 63765 b are listed in Table 3.
3.3. A 55-day-period Neptune-like planet around HD 104067
HD 104067 has been observed with HARPS since February 2004. Altogether, 88 radial-velocity measurements with a typical signal-to-noise ratio of ≈ 172 (per pixel at 550 nm) and a mean measurement uncertainty (including photon noise and calibration errors) of 43 cm s-1 were gathered. A stellar velocity jitter of 3.0 ms-1 was quadratically added to the mean radial velocity uncertainty.
A strong peak is present in the periodogram at ≈ 56 day (see Fig. 3), which is identified as a Neptune-like planet in a circular orbit by the genetic algorithm. We investigated whether the presence of stellar spots could mimic the short amplitude P = 55.81 day Keplerian motion and explain such a large  since the derived orbital period – from activity index – is 34.7 days. The bissector inverse slope, as well as the (see Fig. 1), do not present any variation at the period of P = 55.81 day, while the measured radial velocities show a clear Keplerian signature. The detection of the 55.81-day-period Neptunian planet is therefore confirmed.
The residuals’ dispersion is fairly large (σ = 4.6 ms-1) and shows a clear low frequency oscillation at P ≈ 500 day that mimics the signature of a second Neptunian planet. However, this signal is correlated with the activity index (see Fig. 4), ruling out the detection of a second long period planet in the system. Resulting orbital parameters are listed in Table 3.
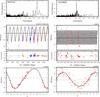 |
Fig. 3 Top: generalized Lomb-Scargle periodogram of the radial-velocity measurements for both HD 63765 (left) and HD 104067 (right). Middle: radial-velocity measurements as a function of Julian Date obtained with CORALIE (blue and orange dots) and HARPS (red dots). Bottom: HARPS’only phase-folded radial velocities. The best Keplerian, one-planet-solution is displayed as a dark curve whose corresponding orbital elements are listed in Table 2. |
3.4. A 10-day-period Netpunian planet around HD 125595
We have been observing HD 125595 with HARPS since May 2004. Altogether, we have obtained 117 radial-velocity measurements with a typical signal-to-noise ratio of ≈78 (per pixel at 550 nm) and a mean measurement uncertainty (including photon noise and calibration errors) of 1 ms-1.
A clear ≈10-day periodic signal can be seen in the periodogram (ν = 0.1 day-1) with its replica on both sides of the one-day period alias (see Fig. 5). A single-planet Keplerian model was therefore adjusted to the data leading to a P = 9.67 days circular orbit of semi-amplitude K = 4.79 ms-1 (see Fig. 5), which corresponds to a planetary companion of minimum mass msin(i) = 0.77MNept. Corresponding orbital elements are listed in Table 3. The ~3 ms-1 dispersion in the residuals is explained by a significant amount of energy in the periodogram of the residuals around the orbital solution at a period of 37 days (see Fig. 6). This P ~ 37-day energy peak is also present in the periodograms of the CCF FHWM (resp. and bisector inverse slope and is close enough to the rotation period of the star to asses that the observed dispersion in the radial velocities is probably induced by activity.
 |
Fig. 4 Correlation bewtween the activity index and the radial velocity residuals as function of time for HD 104067. Pearson’s r = 0.59. |
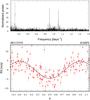 |
Fig. 5 Top: periodogram of HARPS radial velocity measurements of HD 125595. A clear signature is seen at frequency ν = 0.9 day-1 with its replica on both sides of the one-day alias. Bottom: phase-folded radial velocity measurements with the best Keplerian, one-planet-solution represented as a black curve. |
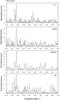 |
Fig. 6 The top figure is the periodogram of the radial velocities residuals (once the 9.67-day-period planet has been subtracted) on the time interval 10 − 100 days. Some residual energy remains close to frequency (resp. period) ν = 0.027 day-1 (resp. P = 37 day). This energy peak is close to the 40-day-rotation period derived from the activity index, and is also present in the periodograms of the CCF FHWM (resp. |
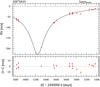 |
Fig. 7 Radial-velocity measurements as a function of Julian Date obtained with HARPS (red dots) on HIP 70849. One of the orbital solution is overplotted as a black line. |
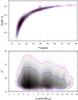 |
Fig. 8 Top: joint probability density function of the orbital period and the eccentricity. The red (resp. blue, cyan) line corresponds to the 1 (resp. 2, 3)σ confidence interval. Bottom: minimum mass distribution of the planetary companions with the same confidence intervals. 99.73% of the solutions have a period between 5 and 90 years, an eccentricity between 0.47 and 0.95 and a minimum mass between 3.5 and 15 MJup. |
3.5. A long-period massive planet around HIP 70849
HIP 70849 has been observed with HARPS since April 2006. Altogether, we gathered 18 radial-velocity measurements with a typical signal-to-noise ratio of ≈ 49 (per pixel at 550 nm) and a mean measurement uncertainty (including photon noise and calibration errors) of 2.2 ms-1. A low frequency radial velocity variation with a large amplitude ( ≈ 200 ms-1) is clearly seen in the data (see Fig. 7). Even though the orbital phase is not correctly covered by our observations, we were lucky enough to obtain radial velocity measurements close to the date of passage through periastron. Running our genetic algorithm followed by MCMC simulations with the simplest model (1 planet, no radial velocity drift) allowed us to bring some constraints on the orbit as shown in Fig. 8. Indeed, at the end of the simulation the chains remained within bounding values with a period between 5 and 90 years, an eccentricity between 0.4 and 0.98 and a minimum mass between 3.5 and 15 MJup. It should be noted that solutions with much longer periods and very high eccentricities exist but could not be probed by our MCMC simulations in a reasonable amount of time. However, the corresponding minimum mass of such solutions remains within the substellar domain. The addition of a linear drift to the model decreases the planet eccentricity, as well as its radial velocity semi-amplitude, which as a result, decreases the mass of the detected object. We also looked at the Hipparcos data to check whether the astrometric signature of the companion (α > 500μarcsec) is detected, to determine the real nature of this object as for HD 5388 b (Sahlmann et al. 2011a). In principle, astrometric motions larger that 1 mas could be detected in the Hipparcos intermediate data as shown by Sahlmann et al. (2011b), provided that the RV orbital elements are determined well and that the period is close to the duration of the Hipparcos mission. In that particular case, the long period of the planet combined with the poor determination of the orbital elements prevents to disentangle the companion signature from Hipparcos proper motions. However, future space missions such as GAIA (Perryman et al. 2001) or JMAPS (Hennessy et al. 2010) will be able to characterize the nature of this object better.
4. Conclusion
We have reported the discovery of four extrasolar planet candidates orbiting moderately active stars
-
HD 63765, HIP 70849,HD 104067, andHD 125595 – discovered withthe HARPS Echelle spectrograph mounted on the 3.6-m ESOtelescope located at La Silla Observatory. Two ofthose planets, HD 125595 band HD 104067 b, areNeptune-mass-planets while the other two –HD 63765,HIP 70849 – are clearly gasgiants.
-
HD 125595 b: according to Mordasini et al. (2009), the planet is too massive (mp = 0.77MNept) to have formed “in situ” since there are not enough planetesimals at 0.08 AU with typical disk profiles. Because its parent star has solar metallicity, the planet probably formed beyond the iceline and then migrated toward the star through tidal interaction with the gaseous disk. The planet is not massive enough to trigger runaway gas accretion.
-
HD 104067 b: the existence of such a planet, however, is hardly explained by planetary formation and evolution scenarios (Ida & Lin 2005; Mordasini et al. 2009). Indeed, the planet is massive enough (mp = 3.4 MNept) to have triggered runaway gas accretion before migrating toward the star. How could the detection of such a planet be explained? Are we biased by the observing techniques since HD 104067 b could be a gas giant provided that its inclination is lower that 30 deg? This question will be answered when such an object is detected in transiting surveys or when a statistically reliable sample of similar object is detected by radial velocity surveys.
-
HD 63765 b: this is a one-year-period Saturn-mass planet with a significant eccentricity. There is nothing peculiar about this object but its detection is useful to build a statistically robust sample of giant planets properties (orbital elements and mass distributions, host star properties).
-
HIP 70849 b: interesting is the presence of a massive giant planet around the 0.63 solar-mass-star HIP 70849. Even though characterized as a K7 dwarf, HIP 70849 is close enough to the very low-mass star domain to present similar planetary formation scenarios. According to Laughlin et al. (2004), Ida & Lin (2005), and Mordasini et al. (2009), the formation of Jupiter-mass planets orbiting very low-mass stars is seriously inhibited at all separations. The presence of this 3 − 15 MJup planet in orbit to HIP 70849 brings to four the number of companions more massive than 2 MJup in orbit around a very low mass star and therefore questions the validity of planets formation scenarios around very low-mass stars. Possible hints of the existence of such objects could be that the mass of their protoplanetary disk did not scale with the mass of the star or, otherwise, that the planet started to form much earlier than usually thought.
The web interface for the Bayesian estimation of stellar parameters, called PARAM 1.0, can be found at http://stev.oapd.inaf.it/cgi-bin/param
Acknowledgments
We are grateful to the staff of the Geneva Observatory, in particular to L. Weber, for maintaining the 1.2-m Euler Swiss telescope and the CORALIE echelle spectrograph at La Silla, and for technical support during observations. We thank the Swiss National Research Foundation (FNRS) and the Geneva University for their continuous support of our planet search programs. N.C.S. would like to acknowledge the support by the European Research Council/European Community under the FP7 through a Starting Grant, as well as from Fundação para a Ciência e a Tecnologia (FCT), Portugal, through program Ciência 2007, and in the form of grants PTDC/CTE-AST/098528/2008 and PTDC/CTE-AST/098604/2008. This research made use of the SIMBAD database and of the VizieR catalog access tool operated at the CDS, France. This publication makes use of data products from the Two Micron All Sky Survey, which is a joint project of the University of Massachusetts and the Infrared Processing and Analysis Center/California Institute of Technology, funded by the National Aeronautics and Space Administration and the National Science Foundation.
References
- Baraffe, I., Chabrier, G., Allard, F., & Hauschildt, P. H. 1998, A&A, 337, 403 [NASA ADS] [Google Scholar]
- Collier Cameron, A., Wilson, D. M., West, R. G., et al. 2007, MNRAS, 380, 1230 [NASA ADS] [CrossRef] [Google Scholar]
- Cutri, R. M., Skrutskie, M. F., van Dyk, S., & Beichman, C. A. 2003, 2MASS All Sky Catalog of point sources, NASA/IPAC Infrared Science Archive [Google Scholar]
- da Silva, L., Girardi, L., Pasquini, L., et al. 2006, A&A, 458, 609 [NASA ADS] [CrossRef] [EDP Sciences] [Google Scholar]
- Delfosse, X., Forveille, T., Ségransan, D., et al. 2000, A&A, 364, 217 [NASA ADS] [Google Scholar]
- ESA 1997, The HIPPARCOS and TYCHO catalogue, ESA-SP 1200 [Google Scholar]
- Forveille, T., Bonfils, X., Lo Curto, G., et al. 2011, A&A, 526, A141 [NASA ADS] [CrossRef] [EDP Sciences] [Google Scholar]
- Girardi, L., Bressan, A., Bertelli, G., & Chiosi, C. 2000, VizieR Online Data Catalog, 414, 10371 [NASA ADS] [Google Scholar]
- Gray, R. O., Corbally, C. J., Garrison, R. F., et al. 2006, AJ, 132, 161 [NASA ADS] [CrossRef] [Google Scholar]
- Gregory, P. C. 2007, MNRAS, 374, 1321 [NASA ADS] [CrossRef] [Google Scholar]
- Hennessy, G. S., Lane, B. F., Veillette, D., & Dieck, C. 2010, in SPIE Conf. Ser. 7731 [Google Scholar]
- Ida, S., & Lin, D. 2005, ApJ, 626, 1045 [NASA ADS] [CrossRef] [Google Scholar]
- Laughlin, G., Bodenheimer, P., & Adams, F. C. 2004, ApJ, 612, L73 [NASA ADS] [CrossRef] [Google Scholar]
- Lo Curto, G., Mayor, M., Benz, W., et al. 2010, A&A, 512, A48 [NASA ADS] [CrossRef] [EDP Sciences] [Google Scholar]
- Lovis, C., Mayor, M., Pepe, F., et al. 2006, Nature, 441, 305 [NASA ADS] [CrossRef] [PubMed] [Google Scholar]
- Lovis, C., Mayor, M., Bouchy, F., et al. 2009, in IAU Symp., 253, 502 [Google Scholar]
- Lovis, C., Ségransan, D., Mayor, M., et al. 2011, A&A, 528, A112 [NASA ADS] [CrossRef] [EDP Sciences] [Google Scholar]
- Mayor, M., Pepe, F., Queloz, D., et al. 2003, The Messenger, 114, 20 [NASA ADS] [Google Scholar]
- Mayor, M., Udry, S., Lovis, C., et al. 2009, A&A, 493, 639 [NASA ADS] [CrossRef] [EDP Sciences] [Google Scholar]
- Mordasini, C., Alibert, Y., Benz, W., & Naef, D. 2009, A&A, 501, 1161 [NASA ADS] [CrossRef] [EDP Sciences] [Google Scholar]
- Mordasini, C., Mayor, M., Udry, S., et al. 2011, A&A, 526, A111 [NASA ADS] [CrossRef] [EDP Sciences] [Google Scholar]
- Moutou, C., Mayor, M., Lo Curto, G., et al. 2011, A&A, 527, A63 [NASA ADS] [CrossRef] [EDP Sciences] [Google Scholar]
- Naef, D., Mayor, M., Lo Curto, G., et al. 2010, A&A, 523, A15 [NASA ADS] [CrossRef] [EDP Sciences] [Google Scholar]
- Noyes, R., Hartmann, L., Baliunas, S., Duncan, D., & Vaughan, A. 1984, ApJ, 279, 763 [NASA ADS] [CrossRef] [Google Scholar]
- Pepe, F., Mayor, M., Delabre, B., et al. 2000, in Optical and IR Telescope Instrumentation and Detectors, ed. A. Moorwood, Proc. SPIE, 4008, 582 [Google Scholar]
- Perryman, M. A. C., de Boer, K. S., Gilmore, G., et al. 2001, A&A, 369, 339 [NASA ADS] [CrossRef] [EDP Sciences] [Google Scholar]
- Queloz, D., Mayor, M., Weber, L., et al. 2000, A&A, 354, 99 [NASA ADS] [Google Scholar]
- Sahlmann, J., Lovis, C., Queloz, D., & Ségransan, D. 2011a, A&A, 528, L8 [NASA ADS] [CrossRef] [EDP Sciences] [Google Scholar]
- Sahlmann, J., Ségransan, D., Queloz, D., et al. 2011b, A&A, 525, A95 [NASA ADS] [CrossRef] [EDP Sciences] [Google Scholar]
- Santos, N., Mayor, M., Naef, D., et al. 2000, A&A, 361, 265 [NASA ADS] [Google Scholar]
- Santos, N., Mayor, M., Naef, D., et al. 2002, A&A, 392, 215 [NASA ADS] [CrossRef] [EDP Sciences] [Google Scholar]
- Ségransan, D., Udry, S., Mayor, M., et al. 2010, A&A, 511, A45 [NASA ADS] [CrossRef] [EDP Sciences] [Google Scholar]
- Skrutskie, M. F., Cutri, R. M., Stiening, R., et al. 2006, AJ, 131, 1163 [NASA ADS] [CrossRef] [Google Scholar]
- Sousa, S. G., Santos, N. C., Mayor, M., et al. 2008, A&A, 487, 373 [NASA ADS] [CrossRef] [EDP Sciences] [MathSciNet] [Google Scholar]
- Udry, S., Mayor, M., Naef, D., et al. 2000, A&A, 356, 590 [NASA ADS] [Google Scholar]
- van Leeuwen, F. 2007, A&A, 474, 653 [NASA ADS] [CrossRef] [EDP Sciences] [Google Scholar]
All Tables
All Figures
|
Fig. 1 Left: chromospheric activity index periodogram for HD 63765, HD 104067, HD 125595, and HIP 70849. Right: Ca II H emission region. The large re-emission at the bottom of the Ca II H absorption line at λ = 3933.66 is an indicator of chromospheric activity. |
| In the text | |
|
Fig. 2 Top: genetic algorithm population at the end of evolution represented in a period-eccentricity diagram. The dark curve is the maximum eccentricity a planet can reach without colliding the star. Bottom: joint probability density function of the radial velocity semi-amplitude and the eccentricity. The red, blue and cyan contour represent the 1 − 3σ confidence intervals of the joint PDF. |
| In the text | |
|
Fig. 3 Top: generalized Lomb-Scargle periodogram of the radial-velocity measurements for both HD 63765 (left) and HD 104067 (right). Middle: radial-velocity measurements as a function of Julian Date obtained with CORALIE (blue and orange dots) and HARPS (red dots). Bottom: HARPS’only phase-folded radial velocities. The best Keplerian, one-planet-solution is displayed as a dark curve whose corresponding orbital elements are listed in Table 2. |
| In the text | |
|
Fig. 4 Correlation bewtween the activity index and the radial velocity residuals as function of time for HD 104067. Pearson’s r = 0.59. |
| In the text | |
|
Fig. 5 Top: periodogram of HARPS radial velocity measurements of HD 125595. A clear signature is seen at frequency ν = 0.9 day-1 with its replica on both sides of the one-day alias. Bottom: phase-folded radial velocity measurements with the best Keplerian, one-planet-solution represented as a black curve. |
| In the text | |
|
Fig. 6 The top figure is the periodogram of the radial velocities residuals (once the 9.67-day-period planet has been subtracted) on the time interval 10 − 100 days. Some residual energy remains close to frequency (resp. period) ν = 0.027 day-1 (resp. P = 37 day). This energy peak is close to the 40-day-rotation period derived from the activity index, and is also present in the periodograms of the CCF FHWM (resp. |
| In the text | |
|
Fig. 7 Radial-velocity measurements as a function of Julian Date obtained with HARPS (red dots) on HIP 70849. One of the orbital solution is overplotted as a black line. |
| In the text | |
|
Fig. 8 Top: joint probability density function of the orbital period and the eccentricity. The red (resp. blue, cyan) line corresponds to the 1 (resp. 2, 3)σ confidence interval. Bottom: minimum mass distribution of the planetary companions with the same confidence intervals. 99.73% of the solutions have a period between 5 and 90 years, an eccentricity between 0.47 and 0.95 and a minimum mass between 3.5 and 15 MJup. |
| In the text | |
Current usage metrics show cumulative count of Article Views (full-text article views including HTML views, PDF and ePub downloads, according to the available data) and Abstracts Views on Vision4Press platform.
Data correspond to usage on the plateform after 2015. The current usage metrics is available 48-96 hours after online publication and is updated daily on week days.
Initial download of the metrics may take a while.