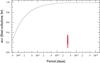
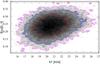
Fig. 2

Top: genetic algorithm population at the end of evolution represented in a period-eccentricity diagram. The dark curve is the maximum eccentricity a planet can reach without colliding the star. Bottom: joint probability density function of the radial velocity semi-amplitude and the eccentricity. The red, blue and cyan contour represent the 1 − 3σ confidence intervals of the joint PDF.
Current usage metrics show cumulative count of Article Views (full-text article views including HTML views, PDF and ePub downloads, according to the available data) and Abstracts Views on Vision4Press platform.
Data correspond to usage on the plateform after 2015. The current usage metrics is available 48-96 hours after online publication and is updated daily on week days.
Initial download of the metrics may take a while.