Fig. 2
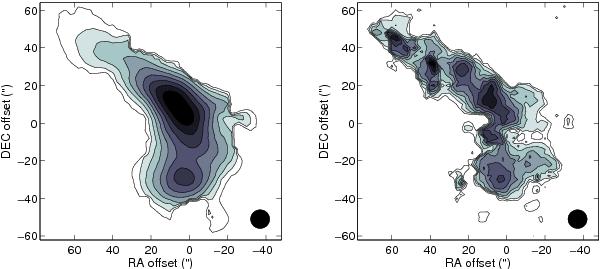
Integrated intensity maps of Oph D in (1, 1) (left) and (2, 2) (right) transitions of NH3 smoothed to 10″ to improve the signal-to-noise ratio of (2, 2) line. The 10″ Gaussian clean beam is indicated in the bottom right corner. The contours are from 10% to 90% with steps of 10% of the map peak values 3.5 K km s-1 and 0.11 K km s-1 for (1, 1) and (2, 2) lines, respectively.
Current usage metrics show cumulative count of Article Views (full-text article views including HTML views, PDF and ePub downloads, according to the available data) and Abstracts Views on Vision4Press platform.
Data correspond to usage on the plateform after 2015. The current usage metrics is available 48-96 hours after online publication and is updated daily on week days.
Initial download of the metrics may take a while.