Fig. 4
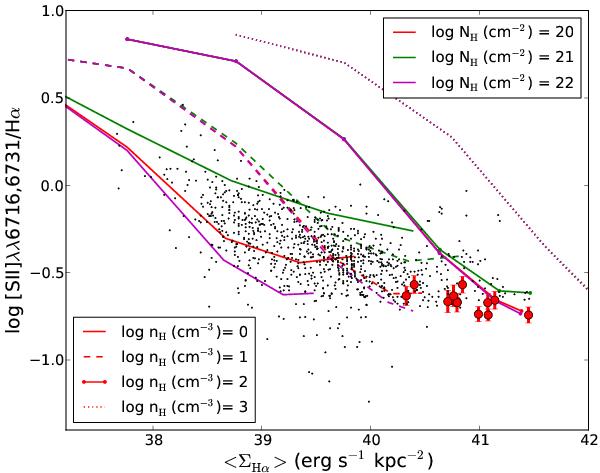
[Sii]λλ 6716,6731/Hα flux ratio versus average Hα surface brightness for our 12 different stacks (see Table 2) of galaxies (red circles, with 1-σ uncertainties) superimposed on data for the diffuse emission in nearby star-forming and starburst galaxies from Wang et al. (1998) (black dots). The lines represent Cloudy photoionization models (Ferland et al. 1998) with various column densities (1020, 1021 and 1022 cm-2 in green, red and purple, respectively), ionization parameters (U = 10-5 to 1 from left to right along each line) and densities (1, 10, 100, 1000 cm-3 as solid, dashed, dot-dash and dotted, respectively). The legend at the upper right indicates the colors of the lines for different column densities, while the legend at the lower left indicates the line styles for each volume density.
Current usage metrics show cumulative count of Article Views (full-text article views including HTML views, PDF and ePub downloads, according to the available data) and Abstracts Views on Vision4Press platform.
Data correspond to usage on the plateform after 2015. The current usage metrics is available 48-96 hours after online publication and is updated daily on week days.
Initial download of the metrics may take a while.