| Issue |
A&A
Volume 534, October 2011
|
|
|---|---|---|
| Article Number | L4 | |
| Number of page(s) | 5 | |
| Section | Letters | |
| DOI | https://doi.org/10.1051/0004-6361/201117609 | |
| Published online | 05 October 2011 | |
Online material
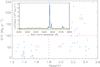 |
Fig. 1
Star-formation rate as a function of redshift for all galaxies used. Red dashed lines correspond to the boundaries between the 3 different bins used to make comparative stacks, which are labeled (1), (2), and (3). As an inset on the left, we show the stacked spectrum (signal-to-noise of Hα weighted average) of all the galaxies in the sample. The lines of Hα, [Nii]λλ6548,6583, and [Sii]λλ6716,6731 are all significantly detected, but we can only set an upper limit on the [Oi]λ6300 emission. |
| Open with DEXTER | |
Detailed properties of all the stacks.
© ESO, 2011
Current usage metrics show cumulative count of Article Views (full-text article views including HTML views, PDF and ePub downloads, according to the available data) and Abstracts Views on Vision4Press platform.
Data correspond to usage on the plateform after 2015. The current usage metrics is available 48-96 hours after online publication and is updated daily on week days.
Initial download of the metrics may take a while.