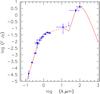
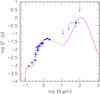
Fig. 10

Top: continuous line (red) shows the prediction of our model (see text) for NGC 3934, (blue) filled circles correspond to data from Table 2 for FUV and NUV, from Table 3 for the B- and R- and from NED for the remaining bands. Arrows show upper limits; error bars account for band width and 3σ uncertainties. Bottom: symbols are the same as in the top panel, but for NGC 3933.
Current usage metrics show cumulative count of Article Views (full-text article views including HTML views, PDF and ePub downloads, according to the available data) and Abstracts Views on Vision4Press platform.
Data correspond to usage on the plateform after 2015. The current usage metrics is available 48-96 hours after online publication and is updated daily on week days.
Initial download of the metrics may take a while.