| Issue |
A&A
Volume 534, October 2011
|
|
|---|---|---|
| Article Number | A101 | |
| Number of page(s) | 8 | |
| Section | Stellar structure and evolution | |
| DOI | https://doi.org/10.1051/0004-6361/201117076 | |
| Published online | 13 October 2011 | |
The 2008 outburst of IGR J17473–2721: evidence for a disk corona?⋆
1
Laboratory for Particle Astrophysics, Institute of High Energy Physics, Beijing 100049, PR China
e-mail: This email address is being protected from spambots. You need JavaScript enabled to view it.
2
ICREA & Institut de Ciències de l’Espai (IEEC-CSIC), Campus UAB, Facultat de Ciències, Torre C5-parell, 2a planta, 08193 Barcelona, Spain
3
ISOC, ESA/ESAC, Urb. Villafranca del Castillo, PO Box 50727, 28080 Madrid, Spain
4
Theoretical Physics Center for Science Facilities (TPCSF), CAS, PR China
Received: 14 April 2011
Accepted: 19 August 2011
Abstract
Context. The 2008 outburst of the atoll source IGR J17473–2721 was observed by INTEGRAL, RXTE and Swift. Tens of type-I X-ray bursts were found in this outburst.
Aims. Joint observations by INTEGRAL, RXTE, and Swift provide sufficient data to look into the behavior of IGR J17473–2721 at the rising part of the 2008 outburst. The relation between the duration of the bursts and the accretion rate and the nature of the corona producing the observed power-law component can therefore be studied in detail.
Methods. We analyze observational data of IGR J17473–2721, focusing on the spectral evolution during the state transition from quiescent to low hard state (LHS), and on the flux dependence of the type-I X-ray bursts along the outburst.
Results. We find that the joint INTEGRAL, RXTE and Swift energy spectrum can be well fitted with a model composed of a blackbody and a cutoff power-law, with a cutoff energy decreasing from ~150 keV to ~40 keV as the source leaves the quiescent state toward the low hard state. This fits into a scenario in which the corona is cooled by the soft X-rays along the outburst evolution, as observed in several other atoll sources. Fifty-seven type-I bursts were reported in the 2008 outburst of IGR J17473–2721. By using the flux measured in the 1.5–30 keV band, we find that the linear relationship between the burst duration and the flux still holds for those bursts that occur at the decaying part of the low hard state, but with a different slope than the overall one that was estimated with the bursts happening in the whole extent of, and for the rest of the low hard state. The significance of such a dichotomy in the type-I X-ray bursts is ~3σ under an F-test. Similar results are hinted at as well with the broader energy-band that was adopted recently. This dichotomy may be understood in a scenario where part of the accreting material forms a corona on the way of falling onto the surface of the neutron star during the decaying part of the low hard state.Based on the accretion rates of the preceding LHS, estimated from type-I X-ray bursts and from persistent emission, at least for IGR J17473-2721, most of the accretion material may fall on the neutron star (NS) surface in the LHS. Considering the burst behavior in the context of the outburst indicates a corona formed on top of the disk rather than on the NS surface.
Key words: X-rays: binaries / X-rays: bursts
Based on observations with INTEGRAL, an ESA project with instruments and science data centre funded by ESA member states (especially the PI countries: Denmark, France, Germany, Italy, Switzerland, Spain), Poland and with the participation of Russia and the USA.
© ESO, 2011
1. Introduction
Low-mass X-ray binaries (LMXB) containing neutron stars (NSs) are classified as atoll or Z sources according to their different spectral and timing evolution during outburst (Hasinger & van der Klis 1989). Atoll sources have a typical luminosity LX < 10% Eddington, and mostly evolve from the island to the banana state, analogous to that of the black hole (BH) counterparts, which evolve from the LHS to the high/soft states (HSS). Z sources are usually brighter, with softer spectra and weaker variability, in analogy to the HSS in BH binaries.
In general, the spectra of LMXB (both BH and NS binaries) are described by two-component models, including a soft/thermal (e.g., a blackbody) and a hard/Comptonized component (e.g., power-law shape with a cutoff at tens to hundreds of keV). It is believed that the hard component evolves in the inverse Compton scattering of soft/thermal photons off the hot electrons in the corona. With respect to the corona itself, two main uncertainties remain for both black hole and NS systems: how are the electrons in the corona energized up to ~100 keV, and what is the corona geometry and location (Reynolds & Nowak 2003). Regarding the latter, the Eastern (Mitsuda et al. 1989) and the Western models (White et al. 1988) have been proposed for NS binaries; whereas models with the so-called “sandwich” geometry, “sphere+disk geometries”, and “patchy corona” were proposed as well for BH binaries (see Fig. 6 of Reynolds & Nowak 2003). The Eastern model considers that the thermal emission arises from the disk and that the Comptonization arises from hot plasma around the neutron star. Instead, the Western model considers that the thermal emission arises from the boundary layer and that the Comptonization arises from the disk.
For the Comptonized components of both BH and NS binaries in LHS, the high-energy cutoff is present at tens to hundreds of keV. This can be an indicator of the electron Maxwellian energy distribution in the corona and approximately twice the electron temperature (Hua & Titarchuk 1995). Studying the evolution of the cutoff energy during outbursts is essential for understanding the accretion processes. For the LHS of BH binaries, the power-law is cut at ~100 keV, while no cutoff was detected up to 10 MeV in the HSS of seven transient BH candidates: GRO J0422+32, GX 339-4, GRS 1716-249, GRS 1009-45, 4U 1543-47, GRO J1655-40, and GRS 1915+105 (Grove et al. 1998). Recently, for the well-studied BH binary GX 339-4, the cutoff energy monotonically decreased, starting from ~200 keV and reaching ~60 keV, while the flux of the whole X-ray band increased during the LHS before the HSS (Motta et al. 2009). Interestingly, the cutoff energy is still detected (at ~100 keV) in high-intermediate and soft-intermediate states and suddenly disappears in the HSS state. For the NS binaries, no cutoffs were observed in the bright Z sources (see the review by Done et al. 2007). For some of the atoll sources observed, the cutoff energy is seen at more than 20 keV in LHS (Barret & Vedrenne 1994). For instance, Chen et al. (2006) found that the cutoff energy changed from ~3 keV to > 30 keV during the spectral transition from the HSS to the LHS of 4U 1608-522, proposing that the existence of a solid surface or the influence of a strong magnetic field may have a great impact on this difference with BH binaries.
However, the changes in the cutoff energy of NS binaries while the source transitions from quiescence to the LHS are much less addressed, partially because the fact that the outbursts are usually caught when the source leaves the quiescent state where the emission dominated by hard X-rays is too weak. The joint observations of the initial rising phase of the outburst from IGR J17473–2721 by INTEGRAL and RXTE provide a nice opportunity to conduct this study. The atoll source IGR J17473–2721 has shown a variety of spectral states/transitions in the 2008 outburst. At the rising phase of this outburst, the source showed hard X-ray flares and stayed in the low/hard state for two months prior to transition to the high/soft state, forming the so-called hysteresis. IGR J17473–2721 is thus the third NS binary with hysteresis after 4U 1908+005 (Aql X-1) and 4U 1608-522 (e.g. Gladstone et al. 2007). The outburst with a low/hard state prior to a high/soft state resemble Aql X-1 and XTE J1550-564. The long-lived preceding LHS makes IGR J17473–2721 to resemble the behavior of outbursts seen in black hole X-ray binaries like GX 339-4. Zhang et al. (2009) presented details of RXTE observations on the outburst, but data for the initial part were not yet available.
Type-I X-ray bursts manifest themselves as a sudden increase (typically by a factor of 10 or greater) in the X-ray luminosity of neutron star systems (NSs), with ~90 X-ray bursters detected in our Galaxy (Grindlay et al. 1976; Belian et al. 1976). Type-I bursts are caused by unstable burning of accreted H/He on the surface of neutron stars in LMXB systems, in contrast to type-II bursts, that are thought to be caused by accretion instability (for reviews, see Lewin et al. 1993; Cumming 2004; Strohmayer & Bildsten 2006; and Galloway et al. 2008). The properties of type-I X-ray bursts depend on the composition of the burning material, how stable the burning of that fuel is, and if there is any left-over fuel from previous bursts. Several other factors can also significantly change the burst properties: individual element reaction rates, fuel mixing in the burning layer, inhomogeneous distribution of fuel, and other aspects.
Tens of type-I bursts were detected in IGR J17473–2721 during outburst by RXTE, INTEGRAL, Swift, and SuperAGILE (Altamirano et al. 2008; Galloway et al. 2008; Chen et al. 2010; Chenevez et al. 2011). Chen et al. (2010), who found 16 bursts, estimated that the distance is likely to be 6.4 ± 0.9 kpc based on the peak flux of three bursts that show photospheric radius expansion. The duration of the 16 type-I bursts occurred in the 2008 outburst is found to correlate with the Eddington ratio and with two parallel evolution groups (Chen et al. 2010). Analysis of more complete RTXE data by Chenevez et al. (2011) revealed that 57 bursts (42 bursts among those detected by RXTE) were born in the 2008 outburst of IGR J17473–2721, with an overall correlation between the burst duration and the flux. However, Chenevez et al. (2011) adopted an expanded energy band (0.1–200 keV) to calculate the bolometric flux of the persistent emission, far beyond RXTE’s best coverage (1.5–30 keV), which may result in flux uncertainties as large as ~40%. This stimulates us to re-investigate the duration/flux relation with this burst sample. Finally, INTEGRAL data on the initial rising part of the outburst were never reported before, which could provide clues on the formation of the outburst from quiescence and help investigating the initial cooling process of the corona. We report on this here as well.
2. Observations and data analysis
The available INTEGRAL observations, when IGR J17473–2721 had an offset angle less than 14° during the outburst in 2008, comprised about 463 SCWs, adding up to an exposure time of ~1.3 Ms (covering revolutions 0663–0723 –one revolution covers ~three days – between MJD 54 545.1 and MJD 54 750.0). However, data only scatter over the rising and decay phases in this outburst, and only the former is used here because of the low significance of detection in the decay phase. The data reduction was performed using the OSA version 9.0. ISGRI and JEMX data are used to extract the spectra and lightcurves. All sources within the FoV that are brighter than, or comparable to, IGR J17473–2721 were taken into account in extracting the source spectrum.
Public data from RXTE (Gruber et al. 1996) on IGR J17473–2721 cover the entire 2008 outburst between April 2008 and October 2008, and include 182 RXTE/PCA pointed observations, with the identifier (OBSID) of proposal number (PN) 93 064, 93 093, and 93 442 in the High Energy Astrophysics Science Archive Research Center (HEASARC). These observations add up to ~475 ks of exposure time on the source, and scatter over the entire outburst. The analysis of the PCA data was performed by using HEAsoft v. 6.6. We filtered the data using the standard RXTE/PCA criteria. Only the PCU2 (in the 0–4 numbering scheme) was used for the analysis, because this PCU was 100% working on during the entire observations. The background file used in the analysis of PCA data is the most recent one for bright-sources found at the HEASARC website1; the detector breakdowns have been removed. Data from cluster 1 of the HEXTE system were used to produce the higher energy spectra.
An additional 1% systematic error is added to the spectra because of calibration uncertainties, if not otherwise specified. The X-ray spectra are fitted with XSPEC v12.5.0 and the model parameters are estimated with a 90% confidence level. In fitting the joint RXTE & INTEGRAL data points, the JEMX, HEXTE, and ISGRI spectra were normalized to the PCA one.
There is only a single OBSID 00031182001 from Swift on IGR J17473–2721 during the 2008 outburst, on 2008 March 3 (MJD 54 556). During the observation, the XRT data were performed with Windows Timing (WT) mode and Photon Counting (PC) mode. We extracted PC mode events using the tool XSELECT V2.4a as a part of HEASOFT v6.9 package, and pile-up effects were corrected.
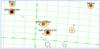 |
Fig. 1 Significance map of IGR J17473–2721 during the outburst in 2008, as observed by INTEGRAL. The contour start at a significance level of 5σ with steps of 50σ. |
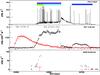 |
Fig. 2 Upper panel: PCA (2–12 keV) lightcurve of IGR J17473–2721 with a time bin of 16 s, in which the spikes are type-I X-ray bursts. The color bar above the PCA lightcurve indicates the burst groups for the subsequent analysis of the relationship between the burst duration and the corresponding persistent flux. Middle panel: the BAT (15–50 keV) lightcurve of IGR J17473–2721 (black) and GRO J1750 − 27 (red) during the outburst in 2008. Lower panel: the ISGRI (20–200 keV) lightcurves of both sources monitored by INTEGRAL. In both of the lower panels the bin size is one day. |
3. Results
3.1. Outburst
We find that IGR J17473–2721 has a detection significance of ~182σ in the 20–200 keV band during the period between MJD 54 545.1 and 54 750.0 (see the INTEGRAL map in Fig. 1). The nearby source GRO J1750-27, that is 48.92 arcmin away from IGR J17473–2721, was out of the RXTE/PCA field of view during the observations. The field of view of RXTE/PCA is ~1 degree, RXTE/PCA can’t distinguish two sources separated by ~1 degree if one is located at the center of the field. RXTE/PCA can avoid contamination from GRO J1750-27 by pointing ~0.2 degree away from IGR J17473-2721. Figure 2 shows the BAT2 and ISGRI lightcurves of both sources in bins of one day.
We extracted the RXTE/PCA lightcurves in 2–12 keV with PCA standard 2 model and binned it into observation identifiers (OBSID), with the background removed. This is shown in the top panel of Fig. 3, where for comparison the INTEGRAL/ISGRI lightcurves in 20–200 keV are also shown. From Fig. 3 it is possible to see that IGR J17473–2721 left from quiescent state and started to be active at around MJD 54 555, with the flux increasing in both energy bands. Roughly 20 days later, at MJD ~ 54 575, the source stayed at the LHS and the corresponding results are reported in Zhang et al. (2009).
To analyze the spectral evolution of the initial rising phase of the outburst from IGR J17473–2721, the ISGRI data were divided into ten groups based on the revolution number: rev. 663, 664, 667–674. For each group we fitted the spectra in the 20–200 keV band with a power-law, a cutoff power-law, or cutoff power-law, both with 1% systematic error included. No RXTE or Swift observations are available during the first two revolutions (663 and 664), and the source is too weak to have a meaningful JEMX spectrum. There is one Swift observation quasi-simultaneous to the INTEGRAL revolution 667, therefore the joint Swift/XRT, INTEGRAL/JEMX and INTEGRAL/ISGRI was derived. IGR J17473-2721 is outside the FoV of JEMX during rev. 668, the joint spectrum was obtained from INTEGRAL/ISGRI, RXTE/PCA and RXTE/HEXTE observations. For rev. 669–674, we fitted the combined INTEGRAL/JEMX, INTEGRAL/ISGRI, RXTE/PCA and RXTE/HEXTE spectrum. RXTE OBSIDs where bursts occurred were excluded from the spectral analysis.
We extracted for each data group the spectra from the combined XRT data in 0.5–10 keV data, the PCU 2 data in the 3–30 keV band, the JEMX data in the 5–25 keV band, the HEXTE cluster 1 data in the 30–100 keV band and ISGRI data in the 20–200 keV band. We used the blackbody model (bbodyrad in Xspec) to fit the thermal component – because the disk emission is hardly visible owing to the relatively steep disk inclination angle (Zhang et al. 2009) – and a cutoff power law for the hard component (Table 1). The iron line is fixed at 6.4 keV and the absorption is set to 3.8 × 10²² atoms/cm2. A constant is introduced to account for the normalization difference among XRT, PCA, JEMX, HEXTE and ISGRI.
We find that at the beginning of the outburst (rev. 663 and 664 between MJD 54 545 and 54 550), and where only ISGRI spectra are available, a power law with a photon index of ~2.2 (typical error of 0.2–1.0) can fit the spectra in the 20–200 keV band well, with reduced χ2 1.6, 1.2 respectively (d.o.f. is 7, 7). For rev. 667 (MJD 54 556), the joint XRT/ISGRI/JEMX data can be fitted with an absorbed cutoff power law model, resulting in a  (1.11 for 134 d.o.f.) comparable to that derived with a simple power law model (1.15 for 135 d.o.f.) (Fig. 4, Table 1). By adding a blackbody and a Gaussian line fixed at 6.4 keV as additional components, the fit can be slightly improved (/d.o.f. ~1.04/130), but the F-test shows a probability of only 0.022.
From rev. 668 (MJD 54 559) onward, the thermal component can be satisfactorily fitted with a blackbody model, while the fit of the hard component by a simple power law turns worse, with a reduced χ2 larger than 2 (Table 1). Adopting the hard component as a a cutoff power law results in better fits, with reduced χ2 improving to ~1 (e.g., Fig. 5 shows the spectral fit during rev. 674 as an example). During the initial rising phase of the outburst we find that the temperature of the soft emission rises from ~1.0 to ~1.3 keV, and the radius of blackbody slowly increases from ~2.5 km to ~2.7 km, the latter values are compatible to those derived from the subsequent low/hard state as reported in Zhang et al. (2009). As the source left the quiescent state and started to be active, the cutoff energy of the hard component decreased from ~136 keV to ~40 keV, with the latter being consistent with that derived in the subsequent low/hard state as reported in Zhang et al. (2009). The confidence contour plots of Γ and cutoff energy are given in Fig. 8 for three INTEGRAL revolutions. While some correlation between the two parameters is evident in the elliptical shapes of the contours, the different fit results are nicely separated, supporting the reality of the trend shown in the lower two panels of Fig. 3.
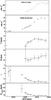 |
Fig. 3 Top two panels: RXTE/PCA lightcurves of IGR J17473–2721 (2–12 keV, time bin is fixed to one obsid) and INTEGRAL/ISGRI, 20–200 keV, time bin is fixed to one day) during the rising phase of its outburst in 2008. The temperature (T) and radius (R) of the blackbody, the photon index (Γ), and the cutoff energy resulting from fit results with Swift/XRT (0.5–10 keV), RXTE/PCA (3–30 keV), RXTE/HEXTE (30–100 keV), INTEGRAL/JEMX (5–25 keV), and INTEGRAL/ISGRI (20–200 keV) are also given in the remaining four panels (the time bin of the bottom panels is one revolution, roughly happening every three days). |
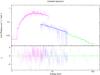 |
Fig. 4 Joint XRT (purple), JEMX (blue), ISGRI (green) spectra of rev. 667 of IGR J17473–2721 during the outburst in 2008, fitted with model: wabs*cutoff. |
 |
Fig. 5 Joint PCA (black), JEMX (blue), HEXTE (red), ISGRI (green) spectra of rev. 674 (the last revolution of INTEGRAL in the rising phase) of IGR J17473–2721 during the outburst in 2008, fitted with model wabs*(bbodyrad+cutoff+Gauss). |
Spectral fit results of the outburst with different models.
3.2. Type-I X-ray bursts
In Chen et al. (2010) we have analyzed 16 bursts that occurred during the 2008 outburst of IGR J17473–2721 and found that they could be grouped into two parallel evolution tracks regarding their burst duration versus their flux. However, such parallel tracks did not show up in the work by Chenevez et al. (2011), where 57 bursts were found in the entire outburst, although the overall trend of a positive relationship still holds. Instead of taking the 0.1–200 keV band by Chenevez et al. (2011) did, we adopt a band well covered by RXTE (1.5–30 keV) to minimize the uncertainties intrinsic to flux extrapolations (see, e.g., Thompson et al. 2008).
By using the persistent flux at 1.5–30 keV and the burst duration τ as derived in Chenevez et al. (2011), we produced the τ-flux diagram. This is shown in Fig. 6, where we also show linear fits (the parameter p1 enclosed in Fig. 6 stands for the slope of these linear fits) to the data related to bursts occurring in different spectral states. We find that the fits worsen when the bursts from HSS and number 8 in the classification of Chenevez et al. (2011) are included. Recently, Zhang et al. (2011) found while analyzing the cooling phase of type-I X-ray bursts in 4U 1636-53 that the bursts occurring in HSS may be He-dominated, while they could be H-dominated in LHS. Burst number 8 occurred less than 10 min later after it predecessor, and it most likely has the same fuel (Fujimoto et al. 1987). We therefore consider an overall sample for the bursts occurring in the LHS that excludes burst number 8. We proceeded to check the τ-flux relationship in burst groups (the different color bars above the PCA lightcurves in the Fig. 1) located in the initial rising LHS, the LHS plateau preceding the HSS, the whole LHS preceding HSS (i.e., the sum of the first two groups), the LHS after the HSS, and the overall sample (see Fig. 6). The correlation factors are derived as 0.90, 0.32, 0.68, 0.75 and 0.35, respectively. A linear fit results in a reduced χ2 ~ 2.1 for the overall and ~1.2–1.8 for the rest. These values seem acceptable because the overall sample consists of grouped bursts showing different slopes in this diagram, for which the χ2 is individually better. We find that the bursts in the decaying LHS present a linear slope of 5.0 ± 1.0, which is substantially different from the 1.7 ± 0.1 of the overall and 0.9–1.8 of the rest (see Fig. 6). A parabolic line slightly improves the fit, with χ2 ~ 62.61 (35 d.o.f.) for all the bursts except number 8. Fitting all bursts except number 8 with a broken line results in a χ2 ~ 53.08 (34 d.o.f.), and a probability of 0.00296 under an F-test for having a marginally-significant turn-over component at the lower flux.
If we enlarge the energy band to 0.1–200 keV, the τ-flux correlation factors of the four burst groups described above are 0.91, 0.29, 0.72, 0.35, and 0.52, respectively. A linear slope is derived as 0.7 ± 0.2 for the leading LHS and 1.9 ± 0.4 for the decaying LHS. Thus, the trend still holds that the linear slope in the decaying LHS is steeper than in the leading LHS, although the persistent flux is estimated with an energy band (0.1–200 keV) well beyond the PCA domain. We also investigate the dependence of thermal and non-thermal emission, respectively, and obtained correlation factors of 0.44 and 0.73 (see Fig. 7). Because the thermal emission is weak in the low/hard state, the error bars of the thermal flux turn out to be too large in Fig. 7, which prevent us from inferring the τ-flux relationship further than a simple overall positive correlation. Moreover it is hard to disentangle the disk emission from the thermal emission from the neutron star surface. But apart from this the diagram of τ vs. thermal flux as shown in Fig. 7 may be used as an standard candle in investigating the dependence of the burst duration on the accretion rate.
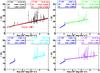 |
Fig. 6 Timescale τ vs. the persistent flux in the 1.5–30 keV band for the bursts occurring in LHS. The black points represent all of the bursts together (upper left panel). For comparison, each burst group is plotted together with the results of a linear fit to this group marked by different colors. The top-left panel shows the fit results for all bursts (with larger reduced χ2, black) and all bursts except the burst number 8 (in red). The top-right panel shows the fit results of the bursts during LHS after the HSS (blue), and the bursts occurring during the rising part of the LHS before the HSS (green). The bottom-left panel presents the fit results of the bursts happening at the plateau of the LHS before the HSS and the bottom-right panel those for the bursts occurring during the LHS before the HSS (purple), for comparison. The fit results for the bursts in the LHS after the HSS (green) are also included. |
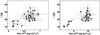 |
Fig. 7 Plots of the timescale τ vs. the thermal (left panel with bolometric blackbody flux) and non-thermal (right panel with power-law component in the 1–100 keV band) persistent flux for the bursts occurring in the LHS. |
4. Discussion
4.1. Spectral evolution from quiescent state to LHS
The cutoff energy of the power-law component in X-ray spectra is a diagnostic parameter of the electron energy distribution in the corona and of the analytical approximation of unsaturated Comptonization. The latter is used extensively to study the X-ray evolution of BH and NS XRB outbursts (e.g., Motta et al. 2009; Chen et al. 2006). In general, the spectrum is typical of an LHS with a high energy cutoff at ~40 keV for the NS binaries and ~80 keV for the BH binaries. However, there are only a few sources observed in the X-ray band at the beginning of the outburst because either the transition is too quick or the source is too faint in this period. This is especially true for the NS X-ray binaries because only the low-luminous-type atoll sources reach the LHS. For instance, for the LHS of the outburst from Aql X-1 in 2005, which has an LHS before an HSS analogous to IGR J17473–2721, the cutoff energy is ~30 keV and no cutoff was detected up to 150 keV in the following HSS (Rodriguez et al. 2006).
In the 2008 outburst of IGR J17473–2721 we have found here that the cutoff energy Ecut gradually decreases in the state transition from quiescence to LHS state within ten days, which is very similar to the spectral evolution observed from BH X-ray binaries. Accompanied with the spectral evolution shown in our previous work (Zhang et al. 2009), evidently sees that Ecut abruptly decreases from  keV to ~5 keV when the source moves from the LHS plateau to HSS, within three days. For the LHS after the HSS, the hard tail of spectra was fitted with a bknpow (Ebkn ~ 51 keV) or Comptt (Ee ~ 22 keV). This complete evolution of the spectrum follows the sequence of quiescent state → LHS → HSS → LHS in the outburst of IGR J17473–2721.
From the observations of the transition from quiescent state → LHS in IGR J17473–2721 with RXTE and INTEGRAL, one sees that the total flux is rising in the soft and hard X-ray bands (3–200 keV), the spectra become hard, and Ecut decreases monotonously. This resemblance in spectral behavior between BH and NS binaries may be a clue for understanding the state transitions in both systems, which is related to the cooling/heating of the corona by the photons produced at the accretion disk or/and the NS surface (Esin et al. 1997; Menou et al. 1999). However, after the initial LHS, spectral differences between BH and NS binaries occur. From our previous work (Zhang et al. 2009), Ecut of IGR J17473–2721 in HSS was measured to be ~5 keV, similar to that of 4U 1608-522 (Ecut ~ 3 keV in its HSS, as reported by Chen et al. 2006). These values are different from BH systems (where no cutoff is observed in HSS). This inconsistency between the two systems may be related to the existence of a hard surface or/and the magnetic field in NS binaries (Chen et al. 2006; Zhang et al. 1996).
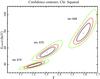 |
Fig. 8 Six-eight percent (1σ, inner, black), 90% (1.6σ, middle, red), and 99.7% (3σ, outer, green) confidence level contours of the high-energy cut-off energy Ecutoff versus the photon index Γ based on the joint PCA/JEMX/HEXTE/ISGRI spectra of rev. 668, rev. 670 and rev. 674 (the last revolution of INTEGRAL in the rising phase) of IGR J17473–2721. The best-fit value is indicated by a “+”. |
4.2. Does most of the accretion material fall to the NS surface in the LHS?
The persistent emission is usually taken as an estimator of the accretion rate in XRB; but it is not always easy to find out if a significant outflow reduces the final inflow rate onto the central compact object. It is also not clear whether the inflowing material exhausts all its gravitational potential energy before reaching the surface of an NS or the event horizon of a BH. Fortunately, under the assumption that the burst exhausts the entire accreted material on the NS surface, bursts may be used to provide a good estimate for the actual inflowing rate; this cannot be done easily for BH XRBs.
The accretion rate estimated from the observed persistent emission is given by Ṁp ~ Lp/e, where Lp is the persistent luminosity and e is radiative efficiency. In NS binaries, the potential energy released per nucleon (of mass mp) is GMNSmp/RNS ≈ 200 MeV (MNS = 1.4 M⊙, RNS = 10 km), or ~20% of its rest mass. We then have Ṁp ~ 2.4 × 10¹⁷ g s-1 with Lp ~ 0.11LEdd in the LHS preceding the HSS of IGR J17473–2721.
On the other hand, the inflowing rate can be estimated from the bursts occurred in the LHS preceding the HSS of IGR J17473–2721 by Ṁb ~ Lb/e, where Lb ~ 1.4 × 10⁻³LEdd is the average luminosity of the bursts in the LHS, e ~ Qnuc/938 = (1.6 + 4 ⟨ X ⟩ )/938, Qnuc (in units of MeV) is the energy released per nucleon during the burst, and X is the hydrogen mass fraction of the fuel. Ṁb ~ Ṁp requires ⟨ X ⟩ ~ 0.18, a reasonable value and consistent with the durations of the observed bursts. We therefore suggest that at least for IGR J17473–2721, most of the accreted material will fall to the NS surface in the LHS.
Figure 7 shows that, similarly to other NS binaries in the LHS, the power-law component dominates the persistent flux in the two observed LHSs of IGR J17473–2721. This means that the majority of the gravitational potential energy is released in the corona before reaching the surface of the NS; otherwise the kinetic energy of the accreted material would produce luminous thermal (blackbody) radiation from the surface of the NS.
4.3. Spherical or disk corona?
The almost pure blackbody spectrum of the observed type-I bursts indicates no Comptonization of the thermal photons from the surface of the neutron star, i.e., the corona does not cover a large fraction of the NS surface. The very different ratios between the observed thermal photons and the power-law photons in the quiescent state and in the bursts suggest that the soft photons from the surface of NS do not dominate the cooling of the corona. An additional evidence against spherical corona comes from the previous spectral analysis of this outburst (Zhang et al. 2009), where the system was found to be highly inclined and most of the disk emission is not supposed to be visible. Additional evidence for a disk corona is that a radius ~ 3 km of the blackbody in the persistent flux (the fourth panel of Fig. 5) is more compatible with being a hot spot on the NS surface than its inner accretion disk radius.
On the other hand, a corona on top of the disk has a relatively smaller coverage for the soft X-rays from the surface of the NS, naturally avoiding all the difficulties discussed above. In this case, the non-detection or the low level of the disk’s thermal X-ray emission would suggest that the corona covers the disk almost completely and that a saturated inverse Comptonization process produces the observed power-law spectrum in the persistent emission. We conclude that it is likely that most of the thermal photons from the NS surface are not Comptonized, because the corona covers the disk, but not the NS.
4.4. Toward a ms pulsar system?
By neglecting the influence of a possible outflow on the estimation of the accretion rate, assuming a radiative efficiency of ~ 20% and a typical duty cycle of ~7% (Sivakoff et al. 2008), the mass growing-rate of an accreting NS can be derived as 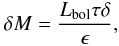 (1)where Lbol is average NS luminosity during outbursts, ϵ is the radiative efficiency, δ is the duty cycle, and τ is the lifetime of the NS binary. By taking τ ~ 108 yr and Lbol ~ 0.1–1 LEdd, we find that the NS will accrete a mass of 0.02–0.22 M⊙ from its companion. Millisecond pulsars (MSP) with a spin period (Ps < 20 ms) seem to have a larger mass (MNS = 1.57 ± 0.35 M⊙) than the mean value of 61 measured masses of NSs (1.46 ± 0.30 M⊙) (Zhang et al. 2011). The estimation above may indicate that a X-ray burster such as IGR J17473–2721 could evolve toward an ms-pulsar system (Demorest et al. 2010).
4.5. Type-I X-ray bursts related to the spectral state of the outburst
For the bursts embedded in the outburst, we found that for H-dominated burning the CNO cycle constrains the speed at which the H fuel is exhausted, which may lead to the burst duration correlating with the accretion rate. The most recent analysis in Zhang et al. (2011) indicates that the bursts at low hard state most likely have H fuel. In Fig. 6 this correlation is present for the bursts in the overall LHS, and the LHS after HSS. The slope of these correlations differs at a significance of ~3σ level, with the slope for the bursts occurring in the decaying LHS being a factor of 3 steeper than that of the overall sample. An extrapolation of the slope for the bursts in the decaying LHS to the other three groups in Fig. 6 would overshoot the lower fluxes. This feature may be related to part of the accretion material holding up to form a corona on its way of falling onto the surface of neutron star during the decaying part of the low hard state. Therefore, the apparent accretion rate on the surface of the neutron star prior to each burst would be overpredicted if one simply were to take take the persistent emission as estimator.
4.6. Summary
With our complementary analysis of INTEGRAL and RXTE observations of the 2008 outburst of IGR J17473–2721 we find that
-
The cutoff energy of the spectra decreases fromEcut ~ 150 keV to ~ 40 keV when the source leaves the quiescent state toward the LHS, which is rarely reported in NS binaries. This phenomenon may be related to the cooling/heating of the corona by the photons produced at the accretion disk or (and or) at the NS surface.
-
The corona seems to be located above the disk, but not around the NS, so that emission from type-I X-ray bursts can escape from the NS surface without suffering Comptonization.
-
The different slopes of the linear relationship hinted in the burst duration vs. the persistence flux diagram for the LHS before and after the HSS may be caused if part of the accretion material is used to form a corona.
pca_bkgd_cmbrightvle_eMv20051128.mdl.
See the Swift/BAT transient monitor results provided by the Swift Team at http://swift.gsfc.nasa.gov/docs/swift/results/transients
Acknowledgments
This work was subsidized by the National Natural Science Foundation of China, the CAS key Project KJCX2-YW-T03, 973 program 2009CB824800 and NSFC-11103020, 11133002. J.M.W. and S.Z. thank the Natural Science Foundation of China for support via NSFC-10521001, 10733010, 10821061, 11073021, 11173023. D.F.T. acknowledges support from the grants AYA2009-07391 and SGR2009-811, as well as the Formosa Program TW2010005. This research has made use of data obtained from the High Energy Astrophysics Science Archive Research Center (HEASARC), provided by NASA’s Goddard Space Flight Center.
References
- Altamirano, D., Degenaar, N., & Markwardt, C. 2008, ATel, 1459 [Google Scholar]
- Barret, D., & Vedrenne, G. 1994, ApJ, 92, 505 [Google Scholar]
- Belian, R. D., Conner, J. P., & Evans, W. D. 1976, ApJ, 206, L135 [NASA ADS] [CrossRef] [Google Scholar]
- Chen, X., Zhang, S.-N., & Ding, G.-Q. 2006, ApJ, 650, 299 [NASA ADS] [CrossRef] [Google Scholar]
- Chen, Y. P., Zhang, S., Torres, D. F., et al. 2010, A&A, 510, A81 [NASA ADS] [CrossRef] [EDP Sciences] [Google Scholar]
- Chenevez, J., Altamirano, D., Galloway, D. K., et al. 2011, MNRAS, 410, 179 [NASA ADS] [CrossRef] [Google Scholar]
- Cumming, A. 2004, Nucl. Phys. B Proc. Suppl., 132, 435 [Google Scholar]
- Demorest, P. B., Pennucci, T., Ransom, S. M., et al. 2010, Nature, 467, 1081 [NASA ADS] [CrossRef] [PubMed] [Google Scholar]
- Done, C., Gierlińiski, M., & Kubota, A. 2007, A&AR, 15, 1 [Google Scholar]
- Esin, A. A., McClintock, J. E., & Narayan, R. 1997, ApJ, 489, 865 [NASA ADS] [CrossRef] [Google Scholar]
- Fujimoto, M. Y., Hanawa, T., & Miyaji, S. 1981, ApJ, 247, 267 [NASA ADS] [CrossRef] [Google Scholar]
- Fujimoto, M. Y., Sztajno, M., Lewin, W. H. G., et al. 1987, ApJ, 319, 902 [CrossRef] [Google Scholar]
- Galloway, D. K., Muno, M. P., Hartman, J. M., et al. 2008, ApJS, 179, 360 [NASA ADS] [CrossRef] [Google Scholar]
- Gladstone, J., Done, C., & Gierlinski, M. 2007, MNRAS, 378, 13 [Google Scholar]
- Grindlay, J., Gursky, H., Schnopper, H., et al. 1976, ApJ, 205, L127 [NASA ADS] [CrossRef] [Google Scholar]
- Grove, J. E., Johnson, W. N., & Kroeger, R. A. 1998, ApJ, 500, 899 [NASA ADS] [CrossRef] [Google Scholar]
- Gruber, D. E., Blanco, P. R., Heindl, W. A., et al. 1996, A&AS, 120, 641 [NASA ADS] [Google Scholar]
- Hasinger, G., & van der Klis, M. 1989, A&A, 225, 79 [NASA ADS] [Google Scholar]
- Hua, X.-M., & Titarchuk, L. 1995, ApJ, 449, 188 [NASA ADS] [CrossRef] [Google Scholar]
- Lewin, W. H. G., van Paradijs, J., & Taam, R. E. 1993, Space Sci. Rev., 62, 223 [NASA ADS] [CrossRef] [Google Scholar]
- Menou, K., Esin, A. A., Narayan, R., et al. 1999, ApJ, 520, 276 [NASA ADS] [CrossRef] [Google Scholar]
- Mitsuda, K., Inoue, H., Nakamura, N., & Tanaka, Y. 1989, PASJ, 41, 97 [NASA ADS] [Google Scholar]
- Motta, S., Belloni, T., & Homan, J. 2009, MNRAS, 400, 1603 [NASA ADS] [CrossRef] [Google Scholar]
- Reynolds, C. S., & Nowak, M. A. 2003, Phys. Rev., 377, 389 [Google Scholar]
- Rodriguez, J., Shaw, S. E., & Corbel, S. 2006 A&A, 451, 1045 [Google Scholar]
- Rybicki, G. B., & Lightman, A. P. 1979, Rad. Proc. Astrophys (New York: Wiley) [Google Scholar]
- Gregory, R. S., Andrés, J., Adrienne, M. J., et al. 2008, ApJ, submitted [arXiv:0806.0627] [Google Scholar]
- Strohmayer, T., & Bildsten, L. 2006, New views of thermonuclear bursts (Compact stellar X-ray sources), 113, 156 [Google Scholar]
- Thompson, T., Galloway, D., Rothschild, R., & Homer, L. 2008, ApJ, 681, 506 [NASA ADS] [CrossRef] [Google Scholar]
- White, N. E., Stella, L., & Parmar, A. N. 1988, ApJ, 324, 363 [NASA ADS] [CrossRef] [Google Scholar]
- Zhang, S. N. 2007, Highlights of Astronomy, 14, 41 [NASA ADS] [Google Scholar]
- Zhang, S. N., Harmon, B. A., & Paciesas, W. S. 1996, A&AS, 120, 279 [NASA ADS] [Google Scholar]
- Zhang, S. N., Cui, W., Chen, W., et al. 2000, Science, 287, 1239 [NASA ADS] [CrossRef] [Google Scholar]
- Zhang, S., Chen, Y. P., Wang, J. M., et al. 2009, A&A, 502, 231 [NASA ADS] [CrossRef] [EDP Sciences] [Google Scholar]
- Zhang, G. B., Mendez, M., & Altamirano, D. 2011, MNRAS, 413, 1913 [NASA ADS] [CrossRef] [Google Scholar]
- Zhang, C. M., Wang, J., Zhao, Y. H., et al. 2011, A&A, 527, A83 [NASA ADS] [CrossRef] [EDP Sciences] [Google Scholar]
All Tables
All Figures
|
Fig. 1 Significance map of IGR J17473–2721 during the outburst in 2008, as observed by INTEGRAL. The contour start at a significance level of 5σ with steps of 50σ. |
| In the text | |
|
Fig. 2 Upper panel: PCA (2–12 keV) lightcurve of IGR J17473–2721 with a time bin of 16 s, in which the spikes are type-I X-ray bursts. The color bar above the PCA lightcurve indicates the burst groups for the subsequent analysis of the relationship between the burst duration and the corresponding persistent flux. Middle panel: the BAT (15–50 keV) lightcurve of IGR J17473–2721 (black) and GRO J1750 − 27 (red) during the outburst in 2008. Lower panel: the ISGRI (20–200 keV) lightcurves of both sources monitored by INTEGRAL. In both of the lower panels the bin size is one day. |
| In the text | |
|
Fig. 3 Top two panels: RXTE/PCA lightcurves of IGR J17473–2721 (2–12 keV, time bin is fixed to one obsid) and INTEGRAL/ISGRI, 20–200 keV, time bin is fixed to one day) during the rising phase of its outburst in 2008. The temperature (T) and radius (R) of the blackbody, the photon index (Γ), and the cutoff energy resulting from fit results with Swift/XRT (0.5–10 keV), RXTE/PCA (3–30 keV), RXTE/HEXTE (30–100 keV), INTEGRAL/JEMX (5–25 keV), and INTEGRAL/ISGRI (20–200 keV) are also given in the remaining four panels (the time bin of the bottom panels is one revolution, roughly happening every three days). |
| In the text | |
|
Fig. 4 Joint XRT (purple), JEMX (blue), ISGRI (green) spectra of rev. 667 of IGR J17473–2721 during the outburst in 2008, fitted with model: wabs*cutoff. |
| In the text | |
|
Fig. 5 Joint PCA (black), JEMX (blue), HEXTE (red), ISGRI (green) spectra of rev. 674 (the last revolution of INTEGRAL in the rising phase) of IGR J17473–2721 during the outburst in 2008, fitted with model wabs*(bbodyrad+cutoff+Gauss). |
| In the text | |
|
Fig. 6 Timescale τ vs. the persistent flux in the 1.5–30 keV band for the bursts occurring in LHS. The black points represent all of the bursts together (upper left panel). For comparison, each burst group is plotted together with the results of a linear fit to this group marked by different colors. The top-left panel shows the fit results for all bursts (with larger reduced χ2, black) and all bursts except the burst number 8 (in red). The top-right panel shows the fit results of the bursts during LHS after the HSS (blue), and the bursts occurring during the rising part of the LHS before the HSS (green). The bottom-left panel presents the fit results of the bursts happening at the plateau of the LHS before the HSS and the bottom-right panel those for the bursts occurring during the LHS before the HSS (purple), for comparison. The fit results for the bursts in the LHS after the HSS (green) are also included. |
| In the text | |
|
Fig. 7 Plots of the timescale τ vs. the thermal (left panel with bolometric blackbody flux) and non-thermal (right panel with power-law component in the 1–100 keV band) persistent flux for the bursts occurring in the LHS. |
| In the text | |
|
Fig. 8 Six-eight percent (1σ, inner, black), 90% (1.6σ, middle, red), and 99.7% (3σ, outer, green) confidence level contours of the high-energy cut-off energy Ecutoff versus the photon index Γ based on the joint PCA/JEMX/HEXTE/ISGRI spectra of rev. 668, rev. 670 and rev. 674 (the last revolution of INTEGRAL in the rising phase) of IGR J17473–2721. The best-fit value is indicated by a “+”. |
| In the text | |
Current usage metrics show cumulative count of Article Views (full-text article views including HTML views, PDF and ePub downloads, according to the available data) and Abstracts Views on Vision4Press platform.
Data correspond to usage on the plateform after 2015. The current usage metrics is available 48-96 hours after online publication and is updated daily on week days.
Initial download of the metrics may take a while.