Fig. 6
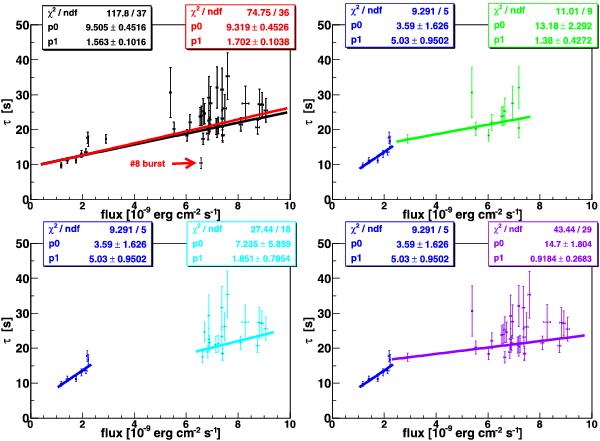
Timescale τ vs. the persistent flux in the 1.5–30 keV band for the bursts occurring in LHS. The black points represent all of the bursts together (upper left panel). For comparison, each burst group is plotted together with the results of a linear fit to this group marked by different colors. The top-left panel shows the fit results for all bursts (with larger reduced χ2, black) and all bursts except the burst number 8 (in red). The top-right panel shows the fit results of the bursts during LHS after the HSS (blue), and the bursts occurring during the rising part of the LHS before the HSS (green). The bottom-left panel presents the fit results of the bursts happening at the plateau of the LHS before the HSS and the bottom-right panel those for the bursts occurring during the LHS before the HSS (purple), for comparison. The fit results for the bursts in the LHS after the HSS (green) are also included.
Current usage metrics show cumulative count of Article Views (full-text article views including HTML views, PDF and ePub downloads, according to the available data) and Abstracts Views on Vision4Press platform.
Data correspond to usage on the plateform after 2015. The current usage metrics is available 48-96 hours after online publication and is updated daily on week days.
Initial download of the metrics may take a while.