Fig. 2
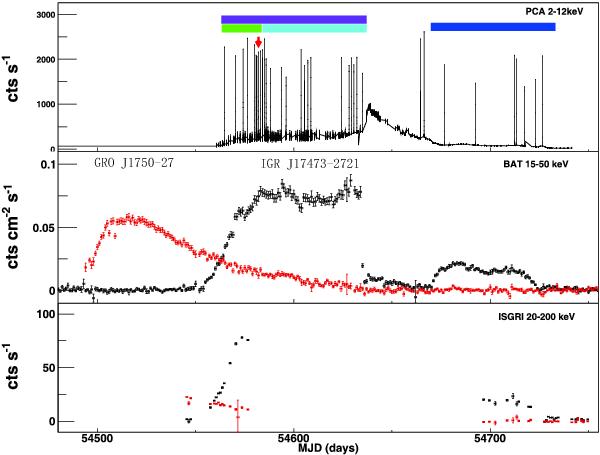
Upper panel: PCA (2–12 keV) lightcurve of IGR J17473–2721 with a time bin of 16 s, in which the spikes are type-I X-ray bursts. The color bar above the PCA lightcurve indicates the burst groups for the subsequent analysis of the relationship between the burst duration and the corresponding persistent flux. Middle panel: the BAT (15–50 keV) lightcurve of IGR J17473–2721 (black) and GRO J1750 − 27 (red) during the outburst in 2008. Lower panel: the ISGRI (20–200 keV) lightcurves of both sources monitored by INTEGRAL. In both of the lower panels the bin size is one day.
Current usage metrics show cumulative count of Article Views (full-text article views including HTML views, PDF and ePub downloads, according to the available data) and Abstracts Views on Vision4Press platform.
Data correspond to usage on the plateform after 2015. The current usage metrics is available 48-96 hours after online publication and is updated daily on week days.
Initial download of the metrics may take a while.