Fig. 2
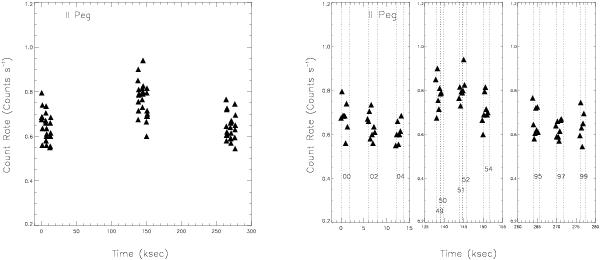
Light curves in the O vi lines (1032 + 1038 Å) for II Peg. The left-hand panel shows the entire time period of the FUSE observations, while the right shows an expanded portion of the individual observations, plus vertical dashed lines for the exposure windows from IDF_CUT. Labels for phases p00 to p99 are given and correspond to the Specnum names in Table 2. The bin size is 200 s for both light curves.
Current usage metrics show cumulative count of Article Views (full-text article views including HTML views, PDF and ePub downloads, according to the available data) and Abstracts Views on Vision4Press platform.
Data correspond to usage on the plateform after 2015. The current usage metrics is available 48-96 hours after online publication and is updated daily on week days.
Initial download of the metrics may take a while.