Fig. 2
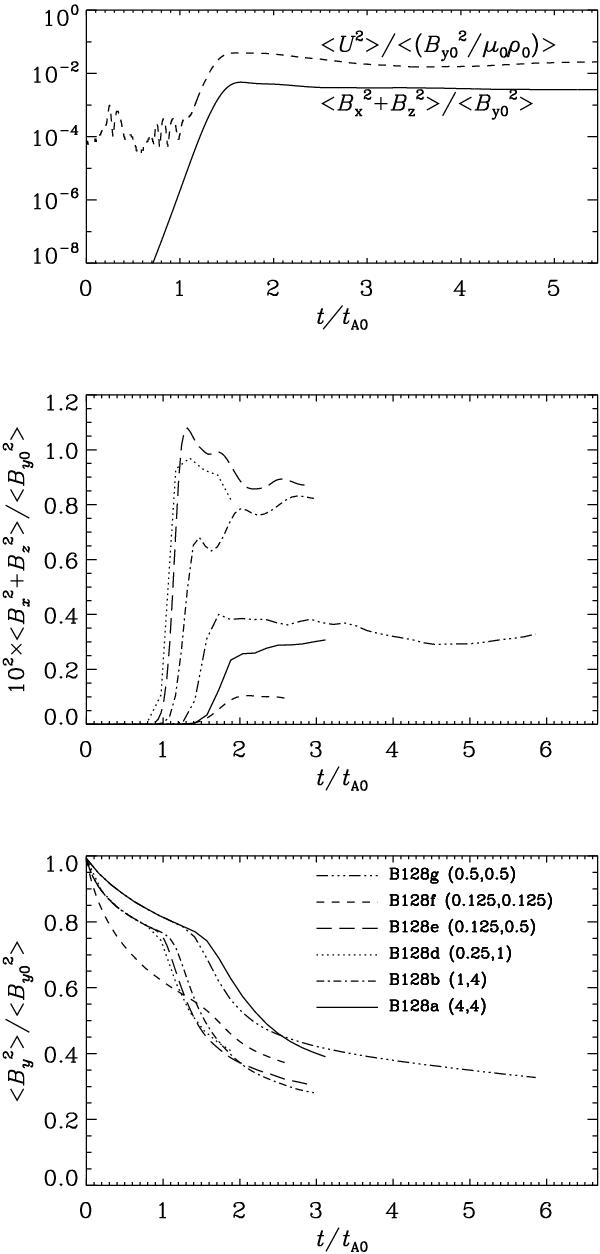
Time evolution of the runs in Table 2.
Upper panel: mean squared values of velocity and generated
magnetic field components Bx,
Bz of run B128c
(Pr = PrM = 1) scaled by  and
and
 respectively. Note
the clear exponential growth until
t ≈ 1.4tA0. Fast oscillations in
⟨ U2 ⟩ until
t ≈ tA0 indicate g-modes originating
from the initial velocity perturbation. Middle panel: mean squared
values of generated magnetic field components for different runs. For legend see
lower panel. Lower panel: rms value of
By. Prandtl numbers indicated as
(Pr, PrM).
respectively. Note
the clear exponential growth until
t ≈ 1.4tA0. Fast oscillations in
⟨ U2 ⟩ until
t ≈ tA0 indicate g-modes originating
from the initial velocity perturbation. Middle panel: mean squared
values of generated magnetic field components for different runs. For legend see
lower panel. Lower panel: rms value of
By. Prandtl numbers indicated as
(Pr, PrM).
Current usage metrics show cumulative count of Article Views (full-text article views including HTML views, PDF and ePub downloads, according to the available data) and Abstracts Views on Vision4Press platform.
Data correspond to usage on the plateform after 2015. The current usage metrics is available 48-96 hours after online publication and is updated daily on week days.
Initial download of the metrics may take a while.