Fig. 3
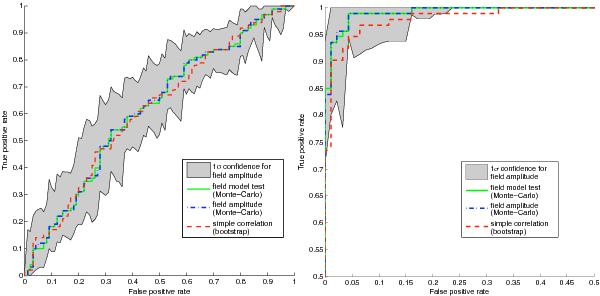
ROC curves for the three-step Saclay method for the 2MASS survey (left) and the Euclid survey (right). Note the axes in the right-hand panel are different from the left-hand panel. The statistical methods correspond to fields model test (thin solid green, Method 3 in Table 3), field amplitude estimation (dot-dashed blue, Method 2), simple correlation (dashed red, Method 1). For the 2MASS survey, all methods are inside the 1σ error bar of the field’s amplitude estimation and so are nearly equivalent. For the Euclid-like survey, the statistics return much better values than for 2MASS (i.e., the ROC curves are far from the diagonal). The simple correlation method will return more false positives than the other two methods, which are nearly identical. The ROC curves of the simple correlation test differs sometimes by more than 1σ at some points from the other two methods and so is expected to perform differently.
Current usage metrics show cumulative count of Article Views (full-text article views including HTML views, PDF and ePub downloads, according to the available data) and Abstracts Views on Vision4Press platform.
Data correspond to usage on the plateform after 2015. The current usage metrics is available 48-96 hours after online publication and is updated daily on week days.
Initial download of the metrics may take a while.