| Issue |
A&A
Volume 533, September 2011
|
|
|---|---|---|
| Article Number | A128 | |
| Number of page(s) | 7 | |
| Section | Extragalactic astronomy | |
| DOI | https://doi.org/10.1051/0004-6361/201117422 | |
| Published online | 14 September 2011 | |
Measuring the level of nuclear activity in Seyfert galaxies and the unification scheme
1
Indian Institute of Astrophysics,
Bangalore
560034,
India
e-mail: This email address is being protected from spambots. You need JavaScript enabled to view it.
2
Department of Physics, University of Calicut,
Calicut
673635,
India
3
INAF-Osservatorio di Arcetri, Largo E. Fermi 5,
50125
Firenze,
Italy
4
Harvard-Smithsonian Center for Astrophysics,
60 Garden St. Cambridge,
MA
02138,
USA
Received:
6
June
2011
Accepted:
8
August
2011
Abstract
Context. The unification scheme of Seyfert galaxies hypothesizes that Seyfert type 1s and type 2s are intrinsically similar and the observed differences between the two subtypes are solely due to the differing orientations of toroidal-shaped obscuring material around the AGN. In the framework of the unification scheme, both the Seyfert subtypes are expected to show similar intrinsic nuclear properties such as the absorption-corrected AGN X-ray luminosity, bolometric luminosity, accretion rate and the mass of the supermassive black hole.
Aims. To test the predictions of the Seyfert unification scheme, we make statistical comparison of the distributions of: (i) the absorption-corrected 2.0–10 keV X-ray luminosities; (ii) the bolometric luminosities; (iii) the black hole masses and; (iv) the Eddington ratios, of Seyfert type 1s and type 2s.
Methods. We use an optically selected Seyfert sample in which type 1s and type 2s are matched in properties that are independent to the orientation of the obscuring torus, the AGN axis and the host galaxy.
Results. The distributions of the absorption-corrected 2.0–10 keV X-ray
luminosities ( ), the
bolometric luminosities (LBol), the black masses
(MBH) and, the Eddington ratios (λ) are
statistically similar for the two Seyfert subtypes, consistent with the orientation and
obscuration based Seyfert unification scheme. The Eddington ratio distributions suggest
that both the Seyfert subtypes are accreting at sub-Eddington level with wide span of
Eddington ratios i.e.,10-4–10-1.
), the
bolometric luminosities (LBol), the black masses
(MBH) and, the Eddington ratios (λ) are
statistically similar for the two Seyfert subtypes, consistent with the orientation and
obscuration based Seyfert unification scheme. The Eddington ratio distributions suggest
that both the Seyfert subtypes are accreting at sub-Eddington level with wide span of
Eddington ratios i.e.,10-4–10-1.
Key words: galaxies: Seyfert / X-rays: galaxies / galaxies: active
© ESO, 2011
1. Introduction
Seyfert galaxies are categorized as nearby, low-luminosity, radio-quiet active galactic nuclei (AGNs) powered by accretion onto supermassive black holes. Seyfert galaxies are classified mainly into two subclasses named as type 1 and type 2, based on the presence and absence of broad emission lines in their optical spectra, respectively (Antonucci 1993). Seyfert unification scheme hypothesizes that the two subtypes are intrinsically similar i.e.,belong to the same parent population and appear different solely due to the differing orientations of the obscuring material having toroidal geometry around the AGN. When the plane of the obscuring torus is along the observer’s line-of-sight i.e.,edge-on view (type 2s), the central engine and broad line region clouds are hidden, while in pole-on view (type 1s) the central engine as well as broad line region clouds are directly seen (Antonucci & Miller 1985; Antonucci 1993; Urry et al. 1995).
There have been several attempts to investigate the validity of Seyfert unification scheme, giving both consistent as well as inconsistent results. Results such as the presence of broad emission lines in the polarized optical and infrared spectra of many Seyfert 2s (Moran et al. 2000), the biconical structure of the narrow line region (Wilson 1996), systematically higher X-ray absorbing column density in Seyfert type 2s (Cappi et al. 2006) and similar nuclear radio properties of both the subtypes (Lal et al. 2011) are consistent with the unification scheme. While results such as the absence of hidden Seyfert 1 nuclei in several Seyfert 2s (Tran 2001, 2003), Seyfert 1s being preferentially hosted in galaxies of earlier Hubble type (Malkan et al. 1998), the lack of X-ray absorption in some Seyfert 2s (Panessa & Bassani 2002), and Seyfert 2s having a higher propensity of nuclear starbursts (Buchanan et al. 2006) are inconsistent with the unification scheme. Sample selection is arguably the most important issue in testing the predictions of Seyfert unification scheme and several results inconsistent to the scheme can be explained as due to the biases inherent in the samples (Antonucci 2002). Indeed, it has been shown that the Seyfert samples selected from optical and UV surveys tend to be biased against obscured and faint sources (Ho & Ulvestad 2001). The obscuring torus absorbs the optical, UV photons emanating from AGN and reradiates in infrared (IR). Also, emission at IR wavelengths does not suffer large extinction, therefore, IR selected samples can be less susceptible to selection biases (Spinoglio & Malkan 1989). However, IR selected samples can be biased towards unusually dusty and sources with higher level of nuclear star formation (Buchanan et al. 2006). Seyfert samples selected from X-ray surveys have also been used to test the predictions of the Seyfert unification (Awaki et al. 1991; Smith & Done 1996; Turner et al. 1997; Bassani et al. 1999). However, studies based on [OIII] selected samples have shown that X-ray (E < 10 keV) selected samples are biased against heavily obscured AGNs (Risaliti et al. 1999; Heckman et al. 2005). Hard X-ray photons can transmit through the obscuring material and therefore samples based on hard X-ray surveys are expected to be least biased. However, Seyfert samples based on INTEGRAL and Swift/BAT surveys preferentially contain relatively large number of high luminosity and less absorbed Seyferts (Tueller et al. 2008; Treister et al. 2009; Beckmann et al. 2009), possibly due to less effective area which limits the sensitivity only to bright sources (~10-11 erg s-1 cm-2). Therefore, samples based on hard X-ray surveys are likely to biased against heavily obscured Compton-thick and low luminosity AGNs (Heckman et al. 2005; Wang et al. 2009). Thus, in general, samples derived from flux limited surveys tend to bias against obscured and faint sources.
The quest of testing the validity and limitations of Seyfert unification scheme with more
improved and well defined samples continues (e.g.,Cappi
et al. 2006; Dadina 2008; Horst et al. 2008; Ricci
et al. 2011; Brightman & Nandra
2011), however, issues related to the sample selection still remain. It has been
argued that the samples based on the properties that are independent to the orientation of
the obscuring torus are more appropriate to test the unification scheme (Schmitt et al. 2003; Lal
et al. 2011; Singh et al. 2011). Such
samples are less prone to the biases that are generally inherent in the samples derived from
flux limited surveys. Lal et al. (2011) have
presented a Seyfert sample based on orientation-independent properties and the two Seyfert
subtypes of this sample are matched in the orientation-independent properties. Keeping above
sample selection issues in mind, we use Lal et al.
(2011) sample with the aim to test the Seyfert unification scheme by making
statistical comparison of the distributions of nuclear properties such as the
absorption-corrected 2.0–10 keV X-ray luminosities ( ), the bolometric
luminosities (LBol), the black hole masses
(MBH) and the Eddington ratios (λ) of the
Seyfert type 1s and type 2s.
), the bolometric
luminosities (LBol), the black hole masses
(MBH) and the Eddington ratios (λ) of the
Seyfert type 1s and type 2s.
The structure of this paper is as following. In Sect. 2, we discuss the sample details. In Sect. 3, we discuss the empirical relations that we used to derive the bolometric luminosities of the sample sources. A brief note on Eddington ratios is given in Sect. 4. In Sect. 5, we discuss the comparisons of the absorption-corrected luminosities, the bolometric luminosities, the black hole masses and the Eddington ratios of the two Seyfert subtypes. Throughout the paper we have assumed cosmological parameters H0 = 71 km-1 Mpc-1, Λm = 0.27, and Λvac = 0.73.
2. The sample
We use the Seyfert sample of Lal et al. (2011) that
is consist of 20 (10 type 1s and 10 type 2s) Seyfert galaxies. In this sample, Seyfert
galaxies are defined as radio-quiet ( ; Kellermann et al. 1989), low optical luminosity AGN
(MB > −23; Schmidt & Green 1983), hosted in spiral or lenticular galaxies
(Weedman 1977). The sample selection is based on
the properties that do not depend on the orientation of the obscuring torus, the AGN axis
and the host galaxy. The orientation-independent properties used for the sample selection
are: cosmological redshift, [OIII] λ5007 Å line luminosity, Hubble stage of
the host galaxy, absolute stellar magnitude of the host galaxy and absolute bulge magnitude.
All these properties are also intimately linked to the evolution of AGN as well as host
galaxy. The sample is selected such that the two Seyfert subtypes have matched distributions
in the orientation-independent properties. We refer readers to see Lal et al. (2011) for greater details on the sample selection. The sample
was formulated to study the nuclear radio properties of Seyferts and is constrained by the
Very Large Baseline Interferometer (VLBI) observing feasibility. Lal et al. (2011) noted that 54 Seyferts met VLBI observing feasibility
criterion and 29 of these 54 had all the required orientation-independent parameters in the
literature. From these 29, they picked 20 Seyferts such that the two Seyfert subtypes had
matched distributions in the orientation-independent parameters. The sources which were
deviating in matching the distributions of the orientation-independent parameters were left
out. In other words, the two Seyfert subtypes should lie within the same range of values for
a given parameter to enter into the sample. Also, it was ensured that in a given bin of a
parameter distribution, type 1s do not outnumber the type 2s and vice versa. Indeed, the
selected 20 Seyferts are not unique or complete in any aspect. Nevertheless, the sample is
sufficiently qualified to test the predictions of Seyfert unification scheme at any
wavelength regime since it is based on the orientation-independent properties, and ensure
that the two Seyfert subtypes are intrinsically similar within the framework of the
unification scheme. Furthermore, it is possible to enlarge the sample size by relaxing the
VLBI observing feasibility criterion, but keeping the criterion of similar distributions for
the two Seyfert subtypes in the orientation- independent parameters, intact. However, we
emphasize that the more important issue is the sample selection and not the sample size.
; Kellermann et al. 1989), low optical luminosity AGN
(MB > −23; Schmidt & Green 1983), hosted in spiral or lenticular galaxies
(Weedman 1977). The sample selection is based on
the properties that do not depend on the orientation of the obscuring torus, the AGN axis
and the host galaxy. The orientation-independent properties used for the sample selection
are: cosmological redshift, [OIII] λ5007 Å line luminosity, Hubble stage of
the host galaxy, absolute stellar magnitude of the host galaxy and absolute bulge magnitude.
All these properties are also intimately linked to the evolution of AGN as well as host
galaxy. The sample is selected such that the two Seyfert subtypes have matched distributions
in the orientation-independent properties. We refer readers to see Lal et al. (2011) for greater details on the sample selection. The sample
was formulated to study the nuclear radio properties of Seyferts and is constrained by the
Very Large Baseline Interferometer (VLBI) observing feasibility. Lal et al. (2011) noted that 54 Seyferts met VLBI observing feasibility
criterion and 29 of these 54 had all the required orientation-independent parameters in the
literature. From these 29, they picked 20 Seyferts such that the two Seyfert subtypes had
matched distributions in the orientation-independent parameters. The sources which were
deviating in matching the distributions of the orientation-independent parameters were left
out. In other words, the two Seyfert subtypes should lie within the same range of values for
a given parameter to enter into the sample. Also, it was ensured that in a given bin of a
parameter distribution, type 1s do not outnumber the type 2s and vice versa. Indeed, the
selected 20 Seyferts are not unique or complete in any aspect. Nevertheless, the sample is
sufficiently qualified to test the predictions of Seyfert unification scheme at any
wavelength regime since it is based on the orientation-independent properties, and ensure
that the two Seyfert subtypes are intrinsically similar within the framework of the
unification scheme. Furthermore, it is possible to enlarge the sample size by relaxing the
VLBI observing feasibility criterion, but keeping the criterion of similar distributions for
the two Seyfert subtypes in the orientation- independent parameters, intact. However, we
emphasize that the more important issue is the sample selection and not the sample size.
The criterion of similar distributions of the orientation-independent parameters for the two subtypes and VLBI observing feasibility may introduce a positive bias towards the sources having similar AGN and host galaxies properties. Therefore, this sample may not be claimed as a complete representative of the entire class of Seyfert galaxies. However, more importantly, matched distributions are essential to ensure that we are not comparing entirely intrinsically different sources selected from different parts of the evolution function (luminosity, bulge mass, Hubble type, redshift). Since the AGN and host galaxy properties are likely to affect the AGN surrounding environment e.g.,opening angle of the obscuring torus decreases with the increase in AGN luminosity (Ueda et al. 2003; Hasinger 2008), formation of BLR clouds may depend on the AGN luminosity (Laor 2003; Nicastro 2000), in low luminosity AGNs accretion rate increases from early-type to late-type galaxies (Ho 2009). Therefore, the samples that have large variations in the AGN and host galaxy properties are expected to show the effect of these variations in the observed properties other than the differences owing to the differing orientations of the obscuring torus. Lal et al. (2011) Seyfert sample based on the matched distributions of the orientation-independent parameters, minimizes the impact of differences caused by the differing properties of the AGN as well as host galaxy.
Using the same sample we have shown in our previous paper (Singh et al. 2011, hereafter Paper I) that the comparisons of X-ray properties e.g.,distributions of the observed X-ray luminosities, the absorbing column densities, the equivalent widths of Fe Kα line and the flux ratios of 2.0–10 keV hard X-ray to [OIII] line emission of the two Seyfert subtypes, are consistent with the Seyfert unification scheme.
3. Estimating bolometric luminosity
In order to calculate the bolometric luminosity of a source one requires complete spectral energy distribution (SED) of the source over the entire electromagnetic spectrum. However, in practice complete SED is not available for most of the AGNs. In the literature, both nuclear 2.0–10 keV X-ray luminosity as well as [OIII] λ5007 Å line luminosity have been used to estimate the bolometric luminosity (Heckman et al. 2005; Kauffmann & Heckman 2009; Lamastra et al. 2009). In following subsections we discuss the empirical relations that we use to estimate the bolometric luminosities for our sample sources.
3.1. Using X-ray luminosity
The different studies in the literature have suggested different correction factors to
estimate the bolometric luminosity from the 2.0–10 keV X-ray luminosity (Elvis et al. 1994; Ho
2008). However, the SED of AGN vary with accretion rate and therefore it may not
be appropriate to use a single correction factor to estimate the bolometric luminosity
(LBol) from the nuclear X-ray luminosity
(L2.0−10 keV). We estimated the bolometric luminosity
from absorption-corrected 2.0–10 keV X-ray luminosity using the empirical relation given
in Marconi et al. (2004),
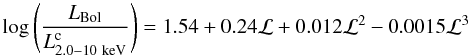 (1)where
ℒ = log LBol−12, and LBol,
are in
units of L⊙. Marconi et al.
(2004) derived this bolometric correction using an average intrinsic SED template
for radio-quiet AGNs and also accounted for the variations in AGN SEDs by using the
well-known anti-correlation between the optical-to-X-ray spectral index
(αOX) and 2500 Å luminosity.
(1)where
ℒ = log LBol−12, and LBol,
are in
units of L⊙. Marconi et al.
(2004) derived this bolometric correction using an average intrinsic SED template
for radio-quiet AGNs and also accounted for the variations in AGN SEDs by using the
well-known anti-correlation between the optical-to-X-ray spectral index
(αOX) and 2500 Å luminosity.
We obtain the absorption-corrected 2.0–10 keV X-ray luminosities
() of our
sample sources using the 0.5–10 keV XMM-N X-ray spectral fits (see,
Paper I). For Compton-thin sources, the absorbing column densities are accurately known
and thus the absorption-corrected fluxes/luminosities can be obtained by fixing the
equivalent hydrogen column density (NH) equal to “0” in the
best X-ray spectral fitting models. However, the correction for X-ray absorption in case
of the Compton-thick sources is non-trivial since photoelectric absorption cut-off and
hence absorbing column density is not measurable by the X-ray observations that are
limited up to 10 keV, e.g.,XMM-Newton, Chandra and ASCA observations. In
order to get the absorption-corrected X-ray fluxes for the Compton-thick sources we have
used flux diagnostic ratio which is based on measuring the X-ray flux against [OIII]
λ5007 Å flux, i.e.,Rx = ![Mathematical equation: \hbox{$\frac{F_{2.0-10.0\rm ~keV}}{F_{\rm [OIII]}}$}](/articles/aa/full_html/2011/09/aa17422-11/aa17422-11-eq24.png) (Bassani et al. 1999; Panessa et al. 2006). We estimate the absorption-corrected 2.0–10.0 keV
X-ray flux/luminosity for a Compton-thick source by multiplying the observed
flux/luminosity with a correction factor fcor that is
approximated as the ratio of the medians of RxCompton−thin to
RxCompton−thick (i.e.,
(Bassani et al. 1999; Panessa et al. 2006). We estimate the absorption-corrected 2.0–10.0 keV
X-ray flux/luminosity for a Compton-thick source by multiplying the observed
flux/luminosity with a correction factor fcor that is
approximated as the ratio of the medians of RxCompton−thin to
RxCompton−thick (i.e.,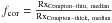 ,
González-Martín et al. 2009), where
RxCompton−thin is
,
González-Martín et al. 2009), where
RxCompton−thin is ![Mathematical equation: \hbox{$\frac{F_{(2.0{-}10.0\rm ~keV)cor}}{F_{\rm [OIII]cor}}$}](/articles/aa/full_html/2011/09/aa17422-11/aa17422-11-eq29.png) (i.e.,the ratio of the absorption-corrected 2.0–10.0 keV flux to the reddening corrected
[OIII] λ5007 Å flux for a Compton-thin source), while
RxCompton−thick is
(i.e.,the ratio of the absorption-corrected 2.0–10.0 keV flux to the reddening corrected
[OIII] λ5007 Å flux for a Compton-thin source), while
RxCompton−thick is ![Mathematical equation: \hbox{$\frac{F_{(2.0-10.0\rm ~keV)obs}}{\rm F_{[OIII]cor}}$}](/articles/aa/full_html/2011/09/aa17422-11/aa17422-11-eq30.png) (i.e.,the ratio of the observed 2.0–10.0 keV flux to the reddening corrected [OIII]
λ5007 Å flux for a Compton-thick sources). In Paper I we report that in
our sample of 20 Seyferts, 7/10 type 2 Seyferts are Compton-thick and 13 Seyferts
(10 type 1s and 3 type 2s) are Compton-thin. Using the median values of
RxCompton−thin and RxCompton−thick in this sample, we estimated
the absorption correction factor fcor ~ 70, which is close to
the one reported in Panessa et al. (2006) by using
similar flux diagnostic method but considering the flux ratios of Seyfert type 1s and
type 2s rather than that of Compton-thick and Compton-thin sources. We caution that the
true value of the correction factor (fcor) may be different
for different sources depending upon the true value of the absorbing column density.
Moreover, we note that our approximated value for the correction factor
Fcor is not too different than that for the typical
Compton-thick Seyferts (Levenson et al. 2006; Brightman & Nandra 2011) and therefore, it is
unlikely to affect our analysis statistically.
(i.e.,the ratio of the observed 2.0–10.0 keV flux to the reddening corrected [OIII]
λ5007 Å flux for a Compton-thick sources). In Paper I we report that in
our sample of 20 Seyferts, 7/10 type 2 Seyferts are Compton-thick and 13 Seyferts
(10 type 1s and 3 type 2s) are Compton-thin. Using the median values of
RxCompton−thin and RxCompton−thick in this sample, we estimated
the absorption correction factor fcor ~ 70, which is close to
the one reported in Panessa et al. (2006) by using
similar flux diagnostic method but considering the flux ratios of Seyfert type 1s and
type 2s rather than that of Compton-thick and Compton-thin sources. We caution that the
true value of the correction factor (fcor) may be different
for different sources depending upon the true value of the absorbing column density.
Moreover, we note that our approximated value for the correction factor
Fcor is not too different than that for the typical
Compton-thick Seyferts (Levenson et al. 2006; Brightman & Nandra 2011) and therefore, it is
unlikely to affect our analysis statistically.
3.2. Using [OIII] λ5007 Å line luminosity
The [OIII] λ5007 Å line emission originates in the narrow line region
and its luminosity correlates with the total AGN power (Mulchaey et al. 1994; Heckman et al.
2005). Also unlike X-ray emission which can be heavily absorbed (e.g.,in
Compton-thick AGNs), [OIII] line emission is not much affected by dust obscuration from
the torus since it originates in the narrow line region which lies outside the torus.
Heckman et al. (2004) reported that for type 1
Seyfert nuclei the average bolometric correction to the extinction uncorrected [OIII]
luminosity is (LBol/L [OIII] )
~ 3500, with a variance of 0.38. However, extinction for the [OIII] emission caused by
dust present in NLR itself can be substantial and therefore extinction-corrected [OIII]
luminosity ( ) is a more direct
indicator of the nuclear luminosity. To estimate the bolometric luminosity from the
[OIII] line luminosity we have used the correction factors given in Lamastra et al. (2009) that are estimated by following a method similar
to Heckman et al. (2004), but using the
extinction-corrected [OIII] luminosity instead of the observed one. Lamastra et al. (2009) reported the luminosity dependent bolometric
correction factors (C [OIII] ) 87, 142, 454 for the
[OIII] luminosity ranges log L [OIII] = 38–40, 40−42,
42–44, respectively. The luminosity-dependent [OIII] correction factors
(C [OIII] ) are obtained by using
) is a more direct
indicator of the nuclear luminosity. To estimate the bolometric luminosity from the
[OIII] line luminosity we have used the correction factors given in Lamastra et al. (2009) that are estimated by following a method similar
to Heckman et al. (2004), but using the
extinction-corrected [OIII] luminosity instead of the observed one. Lamastra et al. (2009) reported the luminosity dependent bolometric
correction factors (C [OIII] ) 87, 142, 454 for the
[OIII] luminosity ranges log L [OIII] = 38–40, 40−42,
42–44, respectively. The luminosity-dependent [OIII] correction factors
(C [OIII] ) are obtained by using
![Mathematical equation: \hbox{$L_{\rm X} - L_{\rm [OIII]}^{\rm c}$}](/articles/aa/full_html/2011/09/aa17422-11/aa17422-11-eq38.png) correlation fit and
the luminosity-dependent X-ray bolometric correction of Marconi et al. (2004). For the sources which do not have extinction-corrected
[OIII] luminosities we have used Heckman et al.
(2004) relation to derive the bolometric luminosities.
correlation fit and
the luminosity-dependent X-ray bolometric correction of Marconi et al. (2004). For the sources which do not have extinction-corrected
[OIII] luminosities we have used Heckman et al.
(2004) relation to derive the bolometric luminosities.
4. Eddington ratio
Eddington luminosity (LEdd) ≃ 1.3 × 1038
(MBH/M⊙) is an upper limit of
the luminosity produced by a black hole of mass MBH. The
Eddington limit is a physical limit at which the outward radiation pressure from the
accreting matter balances the inward gravitational pressure exerted by the black hole. The
mass accretion rate can be parametrized by Eddington ratio
(λ = LBol/LEdd)
that is the ratio of the bolometric luminosity (LBol) to the
Eddington luminosity (LEdd) for a given black hole mass
(MBH). The Eddington ratio can be expressed as
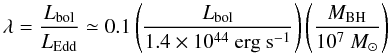 (2)(Wang & Zhang 2007). For all of our sample sources
(except for MRK 1218), the estimated black hole mass is available in the literature. The
black hole masses are estimated using different methods such as reverberation mapping,
M-σ relation (Gebhardt
et al. 2000; Ferrarese & Merritt
2000). In order to calculate Eddington ratio, we need bolometric luminosity
(LBol) that we estimate using the absorption-corrected
2.0–10 keV X-ray luminosity as well as the [OIII] line luminosity. Thus, for a source, we
have two values of the Eddington ratio, one is λX, where
(2)(Wang & Zhang 2007). For all of our sample sources
(except for MRK 1218), the estimated black hole mass is available in the literature. The
black hole masses are estimated using different methods such as reverberation mapping,
M-σ relation (Gebhardt
et al. 2000; Ferrarese & Merritt
2000). In order to calculate Eddington ratio, we need bolometric luminosity
(LBol) that we estimate using the absorption-corrected
2.0–10 keV X-ray luminosity as well as the [OIII] line luminosity. Thus, for a source, we
have two values of the Eddington ratio, one is λX, where
 is used for the
bolometric luminosity and the other one is λ [OIII] , where
is used for the
bolometric luminosity and the other one is λ [OIII] , where
![Mathematical equation: \hbox{$L_{\rm Bol}^{\rm [OIII]}$}](/articles/aa/full_html/2011/09/aa17422-11/aa17422-11-eq49.png) is
used for the bolometric luminosity. Figure 3 shows that
the bolometric luminosities obtained from the X-ray () and the [OIII]
luminosities ()
are similar. There are three sources (i.e.,MRK 231, MRK 1 and NGC 5135) which show more than
one order of magnitude difference between and
.
One possible reason for it may be that values
for these sources are overestimated due to large scatter involved in
is
used for the bolometric luminosity. Figure 3 shows that
the bolometric luminosities obtained from the X-ray () and the [OIII]
luminosities ()
are similar. There are three sources (i.e.,MRK 231, MRK 1 and NGC 5135) which show more than
one order of magnitude difference between and
.
One possible reason for it may be that values
for these sources are overestimated due to large scatter involved in
![Mathematical equation: \hbox{$L^{\rm c}_{\rm [OIII]}$}](/articles/aa/full_html/2011/09/aa17422-11/aa17422-11-eq50.png) −
LBol relation i.e.,in bolometric correction factor C[OIII]
(Lamastra et al. 2009). Starburst contamination to
L [OIII] may also attribute to the overestimation of
as
some of these sources e.g.,MKR 231 (Taylor et al.
1999), NGC 5135 (González Delgado et al.
1998) are known to host circumnuclear starburst. Furthermore,
L [OIII] is only an indirect estimator of the nuclear
luminosity and it depends on various factors such as on the geometry of the system, on the
amount of gas, and on any possible shielding effect that may affect the ionizing radiation
seen by the NLR.
−
LBol relation i.e.,in bolometric correction factor C[OIII]
(Lamastra et al. 2009). Starburst contamination to
L [OIII] may also attribute to the overestimation of
as
some of these sources e.g.,MKR 231 (Taylor et al.
1999), NGC 5135 (González Delgado et al.
1998) are known to host circumnuclear starburst. Furthermore,
L [OIII] is only an indirect estimator of the nuclear
luminosity and it depends on various factors such as on the geometry of the system, on the
amount of gas, and on any possible shielding effect that may affect the ionizing radiation
seen by the NLR.
Absorption-corrected 2.0–10 keV X-ray luminosities, bolometric luminosities, black hole masses and Eddington ratios for two Seyfert subtypes.
5. Discussion
Table 1 lists the absorption-corrected 2.0–10 keV
X-ray luminosities (), the
extinction-corrected [OIII] 5007 Å line luminosities
(![Mathematical equation: \hbox{$L_{\rm [OIII]}^{\rm c}$}](/articles/aa/full_html/2011/09/aa17422-11/aa17422-11-eq56.png) ), the
bolometric luminosities derived from the X-ray as well as the [OIII] luminosities
(
), the
bolometric luminosities derived from the X-ray as well as the [OIII] luminosities
( ,
),
the black hole masses (MBH) and the Eddington ratios
(λX, λ [OIII] ) for the Seyfert
type 1s and type 2s of our sample. In following subsections we discuss the statistical
comparisons of the nuclear properties of the two Seyfert subtypes with the primary aim to
examine the validity of Seyfert unification scheme.
,
),
the black hole masses (MBH) and the Eddington ratios
(λX, λ [OIII] ) for the Seyfert
type 1s and type 2s of our sample. In following subsections we discuss the statistical
comparisons of the nuclear properties of the two Seyfert subtypes with the primary aim to
examine the validity of Seyfert unification scheme.
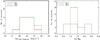 |
Fig. 1 Left: distributions of the absorption-corrected 2.0–10 keV X-ray luminosities (L2.0−10 keV) for the two Seyfert subtypes. Right: distribution of the black hole masses (in M⊙ units) for the two Seyfert subtypes. |
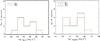 |
Fig. 2 Distributions of the bolometric luminosities (LBol) for
the two Seyfert subtypes. Left: LBol is
derived from |
5.1. Comparison of absorption-corrected 2.0–10 keV X-ray luminosities
In the unification scenario, the X-ray emitting AGN in Seyfert type 2s is viewed through
the obscuring torus and therefore Seyfert type 2s are expected to show lower observed
2.0–10 keV X-ray luminosities than type 1s as long as the obscuring column density is
sufficiently high
(NH > 1022 cm-2).
We have shown in Paper I that the Seyfert type 2s compared to type 1s, show systematically
lower observed soft (0.5–2.0 keV) and hard (2.0–10 keV) X-ray luminosities, consistent
with the unification scheme. Since the differences between the two Seyfert subtypes are
due to the differing orientations of the obscuring torus and therefore if 2.0–10 keV X-ray
luminosities are corrected for the line-of-sight absorption, both Seyfert type 1s and
type 2s are expected to show similar 2.0–10 keV luminosity distributions. Figure 1 shows the 2.0–10 keV absorption-corrected X-ray
luminosity distributions for the two Seyfert subtypes of our sample. In our sample, the
type 1s have in the
range of ~8.3 × 1041 to ~1.6 × 1044 erg s-1 with the
median value ~1.5 × 1043 erg s-1, while for type 2s,
ranges from
~1.1 × 1042 to ~2.8 × 1044 erg s-1 with the median
value ~2.0 × 1043 erg s-1. The two sample KS test confirms that
the Seyfert type 1s and type 2s have similar 2.0–10 keV absorption-corrected X-ray
luminosity distributions, consistent with the unification scheme. The KS test shows that
there is ~79% probability that the
distributions of type 1s and type 2s are drawn from the same parent population
(Table 2). The absorption-corrected 2.0–10 keV
X-ray luminosities for our sample Seyferts are similar to the ones reported in the
previous studies (Cappi et al. 2006). The
absorption-corrected 2.0–10 keV X-ray luminosity can be considered as the representative
of AGN power as long as the X-ray photons in the 2.0–10 keV band are not substantially
diminished by other than photoelectric absorption and are not contaminated by non-AGN
emission. Circumnuclear starburst is reported to be present in some of our sample sources
(e.g.,MRK 477, Heckman et al. 1997; NGC 5135, González Delgado et al. 1998), however, it has been
argued that the circumnuclear starburst mainly contribute to the soft X-ray 0.5–2.0 keV
band and its contamination to 2.0–10 keV keV energy band is not substantial (Levenson et al. 2004).
Medians and Kolmogorov-Smirnov two sample tests for the statistical comparison of various distributions of the two Seyfert subtypes.
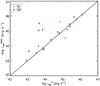 |
Fig. 3 Comparison of the bolometric luminosities (LBol)
obtained from L2.0−10 keV and
L [OIII] respectively. The solid line represents
|
![Mathematical equation: \hbox{$L_{\rm Bol}^{\rm X} = L_{\rm Bol}^{\rm [OIII]}$}](/articles/aa/full_html/2011/09/aa17422-11/aa17422-11-eq70.png)
5.2. Comparison of AGN bolometric luminosities
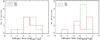 |
Fig. 4 Distributions of the Eddington ratios for the two Seyfert subtypes. Left: LBol is derived from L2.0−10 keV, right: LBol is derived from L [OIII] . |
The bolometric luminosity of AGN represents the rate of energy emitted over the entire
electromagnetic waveband by the accreting black hole. AGN bolometric
(LBol) depends on the mass accretion rate and the radiative
efficiency of the accreting matter. Therefore, if Seyfert type 1s and type 2s are
intrinsically similar as hypothesized by the unification scheme, then both the subtypes
should show similar distributions of the bolometric luminosity. As discussed in Sect. 3,
we have estimated the bolometric luminosities of our sample sources using the
absorption-corrected 2.0–10 keV X-ray luminosity as well as the [OIII] line luminosity.
Figure 2 shows the distributions of bolometric
luminosities ( and
) for
the Seyfert type 1s and type 2s. In our sample, Seyfert type 1s have
ranging from
~8.7 × 1042 to ~6.2 × 1046 erg s-1 with the median
value ~3.0 × 1044 erg s-1, while type 2s have
in the range of
~1.2 × 1043 to ~1.3 × 1046 erg s-1 with the median
value ~4.3 × 1044 erg s-1. The bolometric luminosities derived
from the [OIII] luminosities () also
span over similar range. The for
type 1s spans over ~1.0 × 1043 to ~6.2 × 1046 erg s-1
with the median value ~4.4 × 1044 erg s-1, while for type 2s, it
ranges from ~4.4 × 1044 to ~1.3 × 1046 erg s-1 with
the median value ~1.0 × 1045 erg s-1. The two sample KS test shows
that the two Seyfert subtypes of our sample have similar distributions of bolometric
luminosities ( and
).
There is ~79% and ~99% probability, respectively that the
and
distributions of Seyfert type 1s and type 2s are drawn from the same parent population
(Table 2). The similar distributions of the
bolometric luminosities for the Seyfert type 1s and type 2s of our sample are in the lines
as expected from the unification scheme. The bolometric luminosities (derived from the
X-ray as well as the [OIII] luminosities) for the Seyferts of our sample are in agreement
with the ones reported in the previous studies (Ho
2009).
5.3. Comparison of black hole masses
Black hole mass is one of the fundamental parameters of AGN and if Seyfert type 1s and type 2s differ only due to the orientation of obscuring torus and host similar AGN, then, they are expected to have similar distributions of the supermassive black hole masses. We note that in our sample, black hole masses (MBH) for Seyfert type 1s span over ~3.2 × 10⁶ to ~1.2 × 10⁸ M⊙ with the median value ~1.5 × 10⁷ M⊙, while for type 2s, it ranges from ~1.4 × 10⁷ to ~7.4 × 10⁷ M⊙ with the median value ~1.9 × 10⁷ M⊙. The comparison shows that the distributions of the black hole masses for the type 1s and type 2s of our sample are not significantly different (Fig. 1), which is consistent with the unification scheme. The low p-value ~0.16 (Table 2) in the two sample KS test could be attributed to the small sample size. Our results are broadly in agreement with the previous studies (Panessa et al. 2006; Bian & Gu 2007; Middleton et al. 2008) which report that the black hole mass (MBH) distributions are similar for Seyfert type 1s and type 2s.
5.4. Comparison of Eddington ratios
Eddington ratio (λ = LBol/LEdd) i.e.,AGN bolometric luminosity normalized with Eddington luminosity can be used to characterize the level of nuclear activity (Ho 2008, 2009). For our sample sources we have two estimates of Eddington ratios i.e.,λX, where absorption-corrected 2.0–10 keV X-ray luminosity is used to estimate the AGN bolometric luminosity (LBol) and λ [OIII] , where [OIII] luminosity is used to estimate LBol. Figure 4 shows the distributions of λX and λ [OIII] for the two Seyfert subtypes. We note that for the Seyfert type 1s, λX ranges from ~6.3 × 10⁻⁵ to ~3.5 × 10⁻¹ with the median value ~8.7 × 10⁻³, while for type 2s, it ranges from ~5.1 × 10⁻⁴ to ~6.2 × 10⁻¹ with the median value ~2.0 × 10⁻². The two sample KS test shows that there is ~98% probability that the λX distributions of Seyfert type 1s and type 2s are drawn from the same parent population (Table 2). The distributions of λ [OIII] are also similar (p-value ~0.75) for the two Seyfert subtypes. For Seyfert type 1s, λ [OIII] spans over ~7.6 × 10⁻⁵ to ~4.6 × 10⁻¹ with the median value ~1.7 × 10⁻³, while for type 2s, it spans over ~1.9 × 10⁻³ to ~6.2 × 10⁻¹ with the median value ~4.2 × 10⁻². The similar distributions of Eddington ratios for the two Seyfert subtypes implies that type 1s and type 2s have similar level of accretion and therefore, both the subtypes are intrinsically similar. Some of the literature studies have reported that the Seyfert type 2 galaxies accrete at lower Eddington ratios than type 1 Seyfert galaxies although black hole mass distributions for the two subtypes are similar (Panessa et al. 2006; Middleton et al. 2008). Our results are in contrary to these studies which report that the Seyfert type 2s are accreting at lower Eddington ratios in compared to type 1s. We note that while discussing the difference in the Eddington ratio distributions of the two Seyfert subtypes, Panessa et al. (2006) mention the points of caveats, e.g.,they used a constant correction factor to estimate the bolometric luminosity which may not be appropriate with the fact that the bolometric luminosity depends on the shape of the SED which could differ from high to low luminosity AGN (Ho 1999; Marconi et al. 2004). Also, the absorption-corrected X-ray luminosity distributions for type 1s and 2s of their sample are substantially different which may consequently affect the distributions of Eddington ratios. Middleton et al. (2008) sample is based on hard X-ray observations i.e.,INTEGRAL-IBIS, BeppoSAX-PDS, CGRO-OSSE, and therefore it may be biased to towards relatively bright sources. Middleton et al. (2008) emphasized that Seyfert type 1s and type 2s need to be matched in intrinsic properties such as Eddington ratio in order to explore the orientation based differences. In fact, we follow the similar approach by using a sample in which two Seyfert subtypes are matched in orientation-independent properties (Lal et al. 2011).
Seyfert galaxies of our sample have Eddington ratios much lower compared to luminous AGNs
(i.e.,quasars showing Eddington ratios >10-1, Shemmer et al. 2006) suggesting that the low luminosity
of Seyfert AGN is likely due to low accretion rate. The AGN bolometric luminosities of the
Seyfert galaxies (considering both the subtypes together) of our sample range from
~8.7 × 1042 erg s-1 to
~6.2 × 1046 erg s-1 with the median value of
~3.6 × 1044 erg s-1. If this AGN emission is produced by a
canonical optically thick, geometrically thin accretion disk (Shakura & Sunyaev 1973) that radiates at
Lacc = ηṀc2 = 5.7 × 1045
(η/0.1)
(Ṁ/M⊙ year-1) erg s-1
(see, Ho 2009), then we expect a typical mass
accretion rate in the range of
Ṁ ~ 1.5 × 10⁻³ − 11 M⊙ year-1
with the median value of
6.3 × 10⁻² M⊙ year-1, assuming
radiative efficiency η = 0.1. Ho
(2009) argued that the fuel required for the accretion rate
Ṁ ~ 10-3 M⊙ yr-1
can readily be supplied by the mass loss from evolved stars present in the bulge and the
diffuse hot gas present in the circumnuclear region. The additional supply of fuel such as
higher mass loss rates from the circumnuclear starburst, dissipation from larger scales
nuclear bar or spirals and stellar tidal disruption is likely to present and therefore
higher accretion rates are expected than that shown by low luminosity Seyferts.
Radiatively inefficient accretion flows (RIAFs; Narayan
et al. 1998; Quataert 2001) are generally
invoked to explain the observed low Eddington ratios in low luminosity AGN. The relation
between accretion rate and luminosity in RIAFs can be expressed as
ṁ ≈ 0.7
(α/0.3)(Lbol/LEdd)1/2,
where ṁ = Ṁ/ and
α is viscosity parameter assumed to be ≈0.1−0.3 (see, Ho 2009). The Seyfert galaxies of our sample have
Lbol/LEdd ~ 6.3 × 10⁻⁵−6.2 × 10⁻¹
and this implies ṁ ≈ 1.9 × 10⁻³−1.8 × 10⁻². These
values of accretion rates lie well within the regime of optically thin RIAFs
(ṁ ≤ ṁcrit ≈ α2 ≈ 0.1)
(Narayan et al. 1998).
and
α is viscosity parameter assumed to be ≈0.1−0.3 (see, Ho 2009). The Seyfert galaxies of our sample have
Lbol/LEdd ~ 6.3 × 10⁻⁵−6.2 × 10⁻¹
and this implies ṁ ≈ 1.9 × 10⁻³−1.8 × 10⁻². These
values of accretion rates lie well within the regime of optically thin RIAFs
(ṁ ≤ ṁcrit ≈ α2 ≈ 0.1)
(Narayan et al. 1998).
6. Conclusions
-
We have argued for the importance of sample selection in testingthe predictions of the Seyfert unification scheme and showed thatthe distributions of the nuclear properties i.e.,theabsorption-corrected 2.0–10 keV X-rayluminosities, the bolometric luminosities, the black hole massesand the Eddington ratios are similar for the two Seyfert subtypesof a sample based on orientation-independent properties. Ourresults on the statistical comparison of the nuclear properties ofthe Seyfert type 1s and type 2s areconsistent with the orientation and obscuration based Seyfertunification scheme.
-
The absorption-corrected 2.0–10 keV X-ray luminosities are in the range of ~1042−1044 erg s-1 for both the Seyfert subtypes, with similar median values. The estimated bolometric luminosities derived from the X-ray as well as the [OIII] luminosities are in range of ~1043−1046 erg s-1 for both the Seyfert subtypes, with similar median values.
-
Both the Seyfert subtypes accrete with sub-Eddington rates i.e.,Eddington ratios range ~10-4−10-1 in compared to luminous AGNs (e.g.,quasars with Eddington ratio ~1). The plausible explanation for the substantially low Eddington ratios may be the radiatively inefficient accretion such as advection dominated accretion flow and their variants (Narayan & Yi 1994).
References
- Antonucci, R. 1993, ARA&A, 31, 473 [Google Scholar]
- Antonucci, R. 2002, in AGN Surveys, ed. R. F. Green, E. Y. Khachikian, & D. B. Sanders, ASPC, 284, IAU Colloq., 184, 147 [Google Scholar]
- Antonucci, R. R. J., & Miller, J. S. 1985, ApJ, 297, 621 [NASA ADS] [CrossRef] [Google Scholar]
- Awaki, H., Koyama, K., Inoue, H., & Halpern, J. P. 1991, PASJ, 43, 195 [NASA ADS] [Google Scholar]
- Bassani, L., Dadina, M., Maiolino, R., et al. 1999, ApJS, 121, 473 [NASA ADS] [CrossRef] [Google Scholar]
- Beckmann, V., Soldi, S., Ricci, C., et al. 2009, A&A, 505, 417 [NASA ADS] [CrossRef] [EDP Sciences] [Google Scholar]
- Bian, W., & Gu, Q. 2007, ApJ, 657, 159 [NASA ADS] [CrossRef] [Google Scholar]
- Brightman, M., & Nandra, K. 2011, MNRAS, 413, 1206 [CrossRef] [Google Scholar]
- Buchanan, C. L., Gallimore, J. F., O’Dea, C. P., et al. 2006, AJ, 132, 401 [NASA ADS] [CrossRef] [Google Scholar]
- Cappi, M., Panessa, F., Bassani, L., et al. 2006, A&A, 446, 459 [NASA ADS] [CrossRef] [EDP Sciences] [Google Scholar]
- Dadina, M. 2008, A&A, 485, 417 [NASA ADS] [CrossRef] [EDP Sciences] [Google Scholar]
- Dasyra, K. M., Tacconi, L. J., Davies, R. I., et al. 2006, ApJ, 651, 835 [NASA ADS] [CrossRef] [Google Scholar]
- Elvis, M., Wilkes, B. J., McDowell, J. C., et al. 1994, ApJS, 95, 1 [NASA ADS] [CrossRef] [Google Scholar]
- Ferrarese, L., & Merritt, D. 2000, ApJ, 539, L9 [NASA ADS] [CrossRef] [Google Scholar]
- Gebhardt, K., Bender, R., Bower, G., et al. 2000, ApJ, 539, L13 [NASA ADS] [CrossRef] [Google Scholar]
- González Delgado, R. M., Heckman, T., Leitherer, C., et al. 1998, ApJ, 505, 174 [NASA ADS] [CrossRef] [Google Scholar]
- González-Martín, O., Masegosa, J., Márquez, I., & Guainazzi, M. 2009, ApJ, 704, 1570 [NASA ADS] [CrossRef] [Google Scholar]
- Hasinger, G. 2008, A&A, 490, 905 [NASA ADS] [CrossRef] [EDP Sciences] [Google Scholar]
- Heckman, T. M., Gonzalez-Delgado, R., Leitherer, C., et al. 1997, ApJ, 482, 114 [NASA ADS] [CrossRef] [Google Scholar]
- Heckman, T. M., Kauffmann, G., Brinchmann, J., et al. 2004, ApJ, 613, 109 [NASA ADS] [CrossRef] [Google Scholar]
- Heckman, T. M., Ptak, A., Hornschemeier, A., & Kauffmann, G. 2005, ApJ, 634, 161 [NASA ADS] [CrossRef] [Google Scholar]
- Ho, L. C. 1999, ApJ, 516, 672 [NASA ADS] [CrossRef] [Google Scholar]
- Ho, L. C. 2008, ARA&A, 46, 475 [NASA ADS] [CrossRef] [Google Scholar]
- Ho, L. C. 2009, ApJ, 699, 626 [NASA ADS] [CrossRef] [Google Scholar]
- Ho, L. C., & Ulvestad, J. S. 2001, ApJS, 133, 77 [NASA ADS] [CrossRef] [Google Scholar]
- Horst, H., Gandhi, P., Smette, A., & Duschl, W. J. 2008, A&A, 479, 389 [NASA ADS] [CrossRef] [EDP Sciences] [Google Scholar]
- Kaspi, S., Smith, P. S., Netzer, H., et al. 2000, ApJ, 533, 631 [NASA ADS] [CrossRef] [Google Scholar]
- Kauffmann, G., & Heckman, T. M. 2009, MNRAS, 397, 135 [NASA ADS] [CrossRef] [Google Scholar]
- Kellermann, K. I., Sramek, R., Schmidt, M., Shaffer, D. B., & Green, R. 1989, AJ, 98, 1195 [NASA ADS] [CrossRef] [Google Scholar]
- Lal, D. V., Shastri, P., & Gabuzda, D. C. 2011, ApJ, 731, 68 [NASA ADS] [CrossRef] [Google Scholar]
- Lamastra, A., Bianchi, S., Matt, G., et al. 2009, A&A, 504, 73 [NASA ADS] [CrossRef] [EDP Sciences] [Google Scholar]
- Laor, A. 2003, ApJ, 590, 86 [NASA ADS] [CrossRef] [Google Scholar]
- Levenson, N. A., Weaver, K. A., Heckman, T. M., Awaki, H., & Terashima, Y. 2004, ApJ, 602, 135 [NASA ADS] [CrossRef] [Google Scholar]
- Levenson, N. A., Heckman, T. M., Krolik, J. H., Weaver, K. A., & Życki, P. T. 2006, ApJ, 648, 111 [NASA ADS] [CrossRef] [Google Scholar]
- Malkan, M. A., Gorjian, V., & Tam, R. 1998, ApJS, 117, 25 [NASA ADS] [CrossRef] [Google Scholar]
- Marconi, A., Risaliti, G., Gilli, R., et al. 2004, MNRAS, 351, 169 [NASA ADS] [CrossRef] [Google Scholar]
- Merloni, A., Heinz, S., & di Matteo, T. 2003, MNRAS, 345, 1057 [NASA ADS] [CrossRef] [Google Scholar]
- Middleton, M., Done, C., & Schurch, N. 2008, MNRAS, 383, 1501 [NASA ADS] [CrossRef] [Google Scholar]
- Moran, E. C., Barth, A. J., Kay, L. E., & Filippenko, A. V. 2000, ApJ, 540, L73 [NASA ADS] [CrossRef] [Google Scholar]
- Mulchaey, J. S., Koratkar, A., Ward, M. J., et al. 1994, ApJ, 436, 586 [NASA ADS] [CrossRef] [Google Scholar]
- Narayan, R., & Yi, I. 1994, ApJ, 428, L13 [NASA ADS] [CrossRef] [Google Scholar]
- Narayan, R., Mahadevan, R., & Quataert, E. 1998, in Theory of Black Hole Accretion Disks, ed. M. A. Abramowicz, G. Bjornsson, & J. E. Pringle, 148 [Google Scholar]
- Nicastro, F. 2000, ApJ, 530, L65 [NASA ADS] [CrossRef] [PubMed] [Google Scholar]
- Panessa, F., & Bassani, L. 2002, A&A, 394, 435 [NASA ADS] [CrossRef] [EDP Sciences] [Google Scholar]
- Panessa, F., Bassani, L., Cappi, M., et al. 2006, A&A, 455, 173 [NASA ADS] [CrossRef] [EDP Sciences] [Google Scholar]
- Quataert, E. 2001, in Probing the Physics of Active Galactic Nuclei, ed. B. M. Peterson, R. W. Pogge, & R. S. Polidan, ASPC, 224, 71 [Google Scholar]
- Ricci, C., Walter, R., Courvoisier, T., & Paltani, S. 2011, A&A, 532, A102 [NASA ADS] [CrossRef] [EDP Sciences] [Google Scholar]
- Risaliti, G., Maiolino, R., & Salvati, M. 1999, ApJ, 522, 157 [NASA ADS] [CrossRef] [Google Scholar]
- Schmidt, M., & Green, R. F. 1983, ApJ, 269, 352 [NASA ADS] [CrossRef] [Google Scholar]
- Schmitt, H. R., Donley, J. L., Antonucci, R. R. J., et al. 2003, ApJ, 597, 768 [NASA ADS] [CrossRef] [Google Scholar]
- Shakura, N. I., & Sunyaev, R. A. 1973, A&A, 24, 337 [NASA ADS] [Google Scholar]
- Shemmer, O., Brandt, W. N., Netzer, H., Maiolino, R., & Kaspi, S. 2006, ApJ, 646, L29 [NASA ADS] [CrossRef] [Google Scholar]
- Singh, V., Shastri, P., & Risaliti, G. 2011, A&A, 532, A84 [NASA ADS] [CrossRef] [EDP Sciences] [Google Scholar]
- Smith, D. A., & Done, C. 1996, MNRAS, 280, 355 [NASA ADS] [CrossRef] [Google Scholar]
- Spinoglio, L., & Malkan, M. A. 1989, ApJ, 342, 83 [NASA ADS] [CrossRef] [Google Scholar]
- Taylor, G. B., Silver, C. S., Ulvestad, J. S., & Carilli, C. L. 1999, ApJ, 519, 185 [NASA ADS] [CrossRef] [Google Scholar]
- Tran, H. D. 2001, ApJ, 554, L19 [NASA ADS] [CrossRef] [Google Scholar]
- Tran, H. D. 2003, ApJ, 583, 632 [NASA ADS] [CrossRef] [Google Scholar]
- Treister, E., Urry, C. M., & Virani, S. 2009, ApJ, 696, 110 [NASA ADS] [CrossRef] [Google Scholar]
- Tueller, J., Mushotzky, R. F., Barthelmy, S., et al. 2008, ApJ, 681, 113 [NASA ADS] [CrossRef] [Google Scholar]
- Turner, T. J., George, I. M., Nandra, K., & Mushotzky, R. F. 1997, ApJS, 113, 23 [NASA ADS] [CrossRef] [Google Scholar]
- Ueda, Y., Akiyama, M., Ohta, K., & Miyaji, T. 2003, ApJ, 598, 886 [NASA ADS] [CrossRef] [Google Scholar]
- Urry, K., Padovanni, G., Wilson, A. S., & Yoshida, M. 1995, ApJ, 521, 565 [Google Scholar]
- Wang, J., & Zhang, E. 2007, ApJ, 660, 1072 [NASA ADS] [CrossRef] [Google Scholar]
- Wang, J., Mao, Y. F., & Wei, J. Y. 2009, AJ, 137, 3388 [NASA ADS] [CrossRef] [Google Scholar]
- Weedman, D. W. 1977, ARA&A, 15, 69 [NASA ADS] [CrossRef] [Google Scholar]
- Wilson, A. S. 1996, Vist. Astron., 40, 63 [Google Scholar]
- Woo, J., & Urry, C. M. 2002, ApJ, 579, 530 [NASA ADS] [CrossRef] [Google Scholar]
All Tables
Absorption-corrected 2.0–10 keV X-ray luminosities, bolometric luminosities, black hole masses and Eddington ratios for two Seyfert subtypes.
Medians and Kolmogorov-Smirnov two sample tests for the statistical comparison of various distributions of the two Seyfert subtypes.
All Figures
|
Fig. 1 Left: distributions of the absorption-corrected 2.0–10 keV X-ray luminosities (L2.0−10 keV) for the two Seyfert subtypes. Right: distribution of the black hole masses (in M⊙ units) for the two Seyfert subtypes. |
| In the text | |
|
Fig. 2 Distributions of the bolometric luminosities (LBol) for
the two Seyfert subtypes. Left: LBol is
derived from |
| In the text | |
|
Fig. 3 Comparison of the bolometric luminosities (LBol)
obtained from L2.0−10 keV and
L [OIII] respectively. The solid line represents
|
| In the text | |
|
Fig. 4 Distributions of the Eddington ratios for the two Seyfert subtypes. Left: LBol is derived from L2.0−10 keV, right: LBol is derived from L [OIII] . |
| In the text | |
Current usage metrics show cumulative count of Article Views (full-text article views including HTML views, PDF and ePub downloads, according to the available data) and Abstracts Views on Vision4Press platform.
Data correspond to usage on the plateform after 2015. The current usage metrics is available 48-96 hours after online publication and is updated daily on week days.
Initial download of the metrics may take a while.