| Issue |
A&A
Volume 533, September 2011
|
|
|---|---|---|
| Article Number | A111 | |
| Number of page(s) | 16 | |
| Section | Astrophysical processes | |
| DOI | https://doi.org/10.1051/0004-6361/201117211 | |
| Published online | 09 September 2011 | |
Detection of jet precession in the active nucleus of M 81
1
Max-Planck-Institut für Radioastronomie,
Auf dem Hügel 69,
53121
Bonn,
Germany
e-mail: imartiv@mpifr-bonn.mpg.de
2
Dpt. Astronomia i Astrofísica, Universitat de
València, C/ Dr. Moliner
50, 46100
Burjassot,
Spain
3
Instituto de Astrofísica de Andalucía (CSIC) Apdo. Correos
2004, 08071
Granada,
Spain
Received: 7 May 2011
Accepted: 5 July 2011
We report on very-long-baseline-interferometry (VLBI) monitoring observations of the low-luminosity active galactic nucleus (LLAGN) in the galaxy M 81 at the frequencies of 1.7, 2.3, 5.0, and 8.4 GHz. The observations reported here are phase-referenced to the supernova SN 1993J (located in the same galaxy) and cover from late 1993 to late 2005. The large amount of available observations allows us to study the stability of the AGN position in the frame of its host galaxy at different frequencies and chromatic effects in the jet morphology, together with their time evolution. The source consists at all frequencies of a slightly resolved core and a small jet extension towards the northeast direction (position angle of ~65 degrees) in agreement with previous publications. We find that the position of the intensity peak in the images at 8.4 GHz is very stable in the galactic frame of M 81 (proper motion upper limit about 10 μas per year). We confirm previous reports that the peaks at all frequencies are systematically shifted among them, possibly due to opacity effects in the jet as predicted by the standard relativistic jet model. We use this model, under plausible assumptions, to estimate the magnetic field in the jet close to the jet base and the mass of the central black hole. We obtain a black-hole mass of ~2 × 10⁷ M⊙, comparable to estimates previously reported using different approaches, but the magnetic fields obtained are 103−104 times lower than previous estimates. We find that the positions of the cores at 1.7, 2.3, and 5.0 GHz are less stable than that at 8.4 GHz and evolve systematically, shifting southward at a rate of several tens of μas per year. The evolution in the jet orientation seems to be related to changes in the inclination of the cores at all frequencies. These results can be interpreted as due to a precessing jet. The evolving jet orientation also seems to be related to a flare in the peak flux densities at 5.0 and 8.4 GHz, which lasts ~4 years (from mid 1997 to mid 2001). An increase in the accretion rate of the black hole, and its correlation with the jet luminosity via the disk-jet connection model, seems insufficient to explain this long flare and the simultaneous evolution in the jet orientation. A continued monitoring of the flux density and the jet structure evolution in this LLAGN will be necessary to further confirm our jet precession model.
Key words: galaxies: jets / astrometry / galaxies: active / radiation mechanisms: non-thermal / radio continuum: galaxies / galaxies: individual: M 81
© ESO, 2011
1. Introduction
The galaxy M 81 (NGC 3031), located at a distance of 3.63 ± 0.34 Mpc (Freedman et al. 1994), hosts the next closest active galactic nucleus (AGN) after Centaurus A. Its high declination (J2000.0 coordinates α = 09h55m33.173s and δ = 69°03′55.062′′) also makes M 81 a perfect target for global VLBI observations using the most sensitive radio telescopes in the Northern Hemisphere.
The flux density of the AGN in M 81 (hereafter, M 81*), has relatively large variability, from X-rays (Ishisaki et al. 1996; Page et al. 1994) to radio wavelengths (Ho et al. 1999; and Bietenholz et al. 2000, at centimeter wavelengths; Schödel et al. 2007, at millimeter wavelengths). The variability time scale runs from years to days, indicating a contribution from a very compact source to the emission at all frequencies. Indeed, even from VLBI observations at 43 GHz (Ros & Pérez-Torres 2008) and space-VLBI observations at 5 GHz (Bartel & Bietenholz 2000) the emitting structure could not be fully resolved. The broadband luminosity of M 81* is relatively weak (see, e.g., Ho et al. 1999) from radio (around 100 mJy, i.e., on the order of 1037 erg s-1) to the optical and X-rays (~1040 erg s-1). Therefore, it is classified as a low-luminosity AGN (LLAGN).
The accretion mechanisms in LLAGNs are not clear. Since relativistic X-ray lines are not clearly detected in these objects (e.g., Reynolds et al. 2009), radial flows or advection mechanisms might dominate the accretion, in contrast to the more luminuos AGN. In any case, if the X-ray emission traces the innermost inflow from the disk to the central engine and the radio emission traces the jet power, there should be a relationship between luminosities in both X-rays and radio for all AGNs (i.e., including LLAGNs), which should also be related to the accretion rate. This is the basis of the fundamental-plane model of black-hole accretion (e.g., Merloni et al. 2003). However, the parametric space of very-low accretion flows in AGNs (e.g., LLAGN) is not fully characterized observationally. Although Markoff et al. (2008) and Miller et al. (2010) were able to fit average broadband spectra of M 81* in the frame of the fundamental-plane model of disk-jet connection, no clear correlation between the variabilities in the X-rays and radio was observed unlike in microquasars (Mirabel et al. 1998) and AGNs (Marscher et al. 2002). In the present paper, we report on a very long flare of M 81* at radio frequencies, beginning around mid 1997, which lasted nearly four years. As shown in this paper, an intriguing result related to this flare is that it seems to be related to the evolution in the jet orientation, thus making it difficult explain in the frame of the disk-jet connection between accretion flow and jet power.
At radio frequencies, M 81* has a slightly inverted spectrum with an spectral index α = +0.3 (S ∝ ν+α), up to a turnover frequency of ~200 GHz (Reuter & Lesch 1996). If due to synchrotron self-absorption in the jet, such a high turnover frequency, suggests a very dense plasma and a high magnetic field, and/or a rather flat energy distribution of the relativistic synchrotron-emitting particles (see, e.g., Sect. 4.1 of Reuter & Lesch 1996). In addition, it is worth noticing that the spectral behavior of M 81* is similar to that of the central engine in our Galaxy, Sgr A* (Duschl & Lesch 1994), thus suggesting that similar physical mechanisms should be present in the acceleration of the relativistic particles and their emission at radio frequencies. In addition, the mass of its associated black hole ( M⊙, Devereux et al. 2003;
  M⊙, Schorr Müller et al. 2011) makes M 81* an interesting intermediate object between Sgr A* and the more powerful AGN.
The explosion of the radio-luminous supernova SN 1993J in M 81, which happend around 28 March 1993 (e.g., Weiler et al. 2007), triggered an intense campaign of VLBI observations in which M 81* was selected as the phase calibrator of the SN 1993J visibilities. These observations allow us to study the evolution in the structure and position of M 81*, in the frame of its host galaxy and at different frequencies and times. Results for some of the M 81* observations at 8.4 GHz between years 1993 and 1997 are reported in Bietenholz et al. (2000), and results for the astrometry analysis of a subset of observations at all frequencies between years 1993 and 2002 were reported in Bietenholz et al. (2004). These authors conclude that the proper motion of M 81*, relative to the shell center of SN 1993J, was consistent with zero up to the precision level of the observations (11.4 ± 9.3 μas yr-1). The contributions of galactic rotation and/or any peculiar motion of the SN 1993J progenitor were also discarded to contribute to a detectable proper motion of M 81* relative to the supernova. These authors also report a frequency-dependent shift of the peak of brightness of M 81*, which they interpret as opacity effects in the jet of the AGN, in agreement with the standard relativistic jet model (Blandford & Königl 1979).
In this paper, we report on the analysis of all the VLBI observations of M 81* taken in the phase-referencing observing campaign of SN 1993J, from late 1993 to late 2005. In Sect. 2 we describe our observations. In Sects. 3 and 4 we report the main results obtained (source morphology and multi-frequency astrometry). In Sect. 5, we analyze the astrometry results in terms of the standard jet interaction model (Blandford & Königl 1979), and in the last section we discuss the detection of a changing jet orientation, which we interpret as due to jet precession.
2. Observations and data reduction
We analyzed the VLBI data from the observing campaigns led by N. Bartel (York University, Canada) and J.M. Marcaide (University of Valencia, Spain), from late 1993 to late 2005 (see Table 1 of Martí-Vidal et al. 2011a; and Table 1 of this paper). SN 1993J was observed using M 81* as the phase calibrator at the frequencies of 1.7, 2.3, 5.0, 8.4, 15, and 22 GHz. (There are only a few low-quality observations during years 1993 and 1994 at the two highest frequencies, which have not been used in our analysis.) The results of this observing campaign of SN 1993J are reported in several publications (e.g., Bartel et al. 2002; Marcaide et al. 2009; Martí-Vidal et al. 2011a,b, and references therein), where the technical details of all these observations are given. Basically, one epoch typically lasted ~12 h, with the participation of 10–15 antennas. The whole Very Long Baseline Array (VLBA), the Very Large Array (VLA) in phased-array mode, and some stations of the European VLBI Network (EVN) took part in most of the observations. The recording rate was set to either 128 or 256 Mbit s-1, depending on the technical capabilities of the recording systems at each epoch.
To obtain the calibrated visibilities of M 81* at each epoch, we proceeded as described in Martí-Vidal et al. (2011a). The Astronomical Image Processing System (aips) of the National Radio Astronomy Observatory (NRAO) was used to calibrate the data. Fringe-finder scans were used to align the phases between the different observing sub-bands and, afterwards, global fringe fitting (Alef & Porcas 1986) was applied to the M 81* visibilities. The resulting gains were interpolated to the SN 1993J scans. The amplitude calibration was based on gain curves and system temperatures measured at each station, with the exception of the phased VLA (where estimates of the source flux densities are necessary, since the amplitude calibration is based on measurements of the ratio of effective antenna temperature to system temperature). Then, a refinement of the amplitude gain estimates was performed via self-calibration of the M 81* visibilities, using the aips task CALIB.
3. Results for source morphology
We show in Fig. 1 some representative examples of the VLBI images obtained at all the observing frequencies. The images of M 81* consist of a compact source, which dominates the emission, and a weak extension towards the northeast. These images agree with the results reported in Bietenholz et al. (2000).
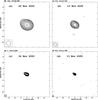 |
Fig. 1 Images of M 81* obtained from the VLBI epochs at a) 1.6 GHz, b) 2.3 GHz, c) 5.0 GHz, and d) 8.4 GHz observed around mid November 2000 (see Table 1). Contours are located at 3, |

3.1. Model fitting
For the analysis of evolution in the M 81* structure, we characterized the model emission at each epoch in a similar way to what was modeled in Bietenholz et al. (2000). We used an elliptical Gaussian to model the central dominant emission and a point source to model the weak jet extension. For those epochs in which the point-source model could not describe the M 81* jet extension satisfactorily, we used a circularly symmetric Gaussian. The point source used to succesfully model the jet extension at some epochs is indicative of a compact emission away from the core (i.e., a hot spot in the jet), at least up to the sensitivity limit achieved in the images.
The defining parameters of the geometrical model described in the previous paragraph were estimated for each epoch by model fitting to the visibilities, as implemented in the program difmap. We show the best-fit model parameters at all frequencies and epochs in Table 1 and Figs. 2–5. For the model of the core emission, the parameters are peak intensity, position angle (both shown in Fig. 2), major axis, and axis ratio (both shown in Fig. 3). For the model of the jet extension, the parameteres are separation from the peak of the core, orientation with respect to the core (both shown in Fig. 4), and flux density (shown in Fig. 5). We notice that the best-fit parameters of the core Gaussians are insensitive to the presence of the additional model component used to describe the jet extension, due to the much smaller contribution of that component to the overall structure of the source. (We notice that the flux density of the jet extension is typically below 7% of the peak flux density of the core, see Fig. 5.) We have discarded some outliers in Table 1 to generate Figs. 2–5. Basically, we discarded those fits in which the final axis ratio of the core Gaussian was zero (i.e., the peak emission could not be satisfactorily described as a 2-dimensional Gaussian) and the few epochs in year 1993 that result in negative position angles.
The typical values for the uncertainties in the model parameters of the core Gaussians were estimated using the following approach. For some representative epochs, we found the peak in the image of the residuals corresponding to the best-fit model. (We call this quantity σ.) Then, we generated a synthetic image of the best-fit model, free of noise from the visibilities. We call this image Ibest. Then, to check the range of parameter values that still lead to satisfactory fits, we changed the values of the parameters (one parameter at a time), generated the corresponding noise-free model images (we call them Ii), and computed the maximum deviation between Ibest and all Ii (i.e., σi = max(| Ibest − Ii|)). The parameter uncertainties were estimated as the changes in the parameter values such that σi = 3σ. Following this approach, the resulting uncertainties are those that translate into changes in the model that are three times greater than the highest noise contribution to the image. The typical uncertainties estimated in this way are given in Table 2. These are the uncertainties assigned to the parameters at each epoch. However, the uncertainty in the average of the parameter values for a given set of epochs is set to be equal to the standard deviation of the parameter values, to reflect the natural scatter in the parameters from epoch to epoch.
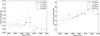 |
Fig. 2 Peak flux density (left) and position angle (right) of the elliptical Gaussians used to model the core emission of M 81* at all frequencies (see Table 1 and text). Typical uncertainties are given in Table 2. |
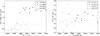 |
Fig. 3 Major axis (left) and axis ratio (right), i.e., minor axis in units of major axis, of the elliptical Gaussians used to model the core emission of M 81* at all frequencies (see Table 1 and text). Typical uncertainties are given in Table 2. |
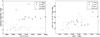 |
Fig. 4 Separation from the core (left) and orientation relative to the core (right) of the jet extension of M 81* at all frequencies. |
Results of astrometry and model fitting of M 81*. In the cases when it was not possible to perform a reliable astrometry (due to poor uv-coverage, too noisy data, or both), we added “–”.
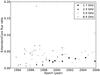 |
Fig. 5 Flux density of the M 81* jet extension relative to the peak intensity of the core. |
Figure 2 (left) shows how the peak intensity at 5.0 and 8.4 GHz of the fitted Gaussians increases from June 1997 to July 1998 and then begins to decrease through June 2001. The maximum peak intensity is a factor ~2 of the typical peak intensities outside this four-year-long flare. Radio-variabilities of several years have been reported for several LLAGN and Seyfert galaxies (Falcke et al. 2001; Nagar et al. 2002; Mundell et al. 2009). However, in this case, as shown below, we also notice hints of a simultaneous evolution in the orientation of the fitted core-Gaussians, which increase the position angle of their major axes from ~60 to ~70 degrees (Fig. 2 right) during the flare. In Sect. 5.3, we also discuss the possible correlation between this flare (together with the changes in the orientation of the fitted core-Gaussians) and our astrometry results at the different frequencies.
Typical uncertainties in the model parameters of the core Gaussians.
Figure 3 shows that the size of the fitted core-Gaussians (i.e., basically the size of the core in the images) is systematically larger at lower frequencies (varies from ~0.5 mas at 8.4 GHz to ~2 mas at 1.7 GHz). The ratio between minor and major Gaussian axes is also higher at lower frequencies, thus indicating that the core regions at lower frequencies are relatively broader. A larger core size at lower frequencies, combined with the frequency-dependent core shift reported in the following sections, indicates an opening angle in the jet, as discussed in Sect. 5.4.
Figure 4 (left) shows how the separation between the peak intensity and the jet extension increases at lower frequencies, with the exception of the data at 2.3 GHz, which gives a larger separation than at 1.7 GHz. This result is intriguing if we interpret the jet extension as an optically-thin region in the jet at all frequencies. In such a case, the distance between the central AGN engine and the (optically-thin) jet extension should be the same at all frequencies. The distance between the core and the jet extension should therefore systematically decrease at lower frequencies if the distance between the central AGN engine and the core increases (as we show in Sect. 5.2). The strange behavior seen in Fig. 4 (left) may indicate that the jet extensions at different frequencies are spatially located in different regions along the jet, although other problems related to the very different spatial resolutions achieved at different frequencies (i.e., blending of jet components at lower resolutions) could also be affecting the results of our model fitting.
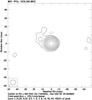 |
Fig. 6 Image of M 81* at 1.7 GHz obtained from the VLBI observations at epoch 2000 November 20 (see Table 1). The FWHM of the convolving beam is shown in the bottom left corner. Natural weighting and a Gaussian taper in Fourier space have been applied (see text). |
Indeed, we notice that the reported jet extensions at 8.4 and 5 GHz are located within the core at 1.7 GHz (the typical core size at 1.7 GHz is ~2−2.5 mas). Therefore, the jet extension at 1.7 GHz (which is located at a distance of ~3−4 mas from the core at the same frequency) must be a physically distinct component, indicating that the successive jet extensions at all frequencies are indeed tracing different parts of a continuous jet. Figure 4 (right) shows that the position angle of the jet extension is similar at all frequencies, thus suggesting a rather straight jet in the region of the emission at all our observing frequencies. This result is supported in the following section, but somewhat in conflict with the results reported in Sect. 5.3.
Finally, Fig. 5 shows the flux density of the jet extension, in units of the core flux density, for all epochs and frequencies. The typical flux density of the extension is lower than ~7% of the core flux density, with the exception of only two epochs: an epoch at the end of year 1996 (around 10% of the core flux density at 8.4 GHz) and another at the end of year 2005 (around 18% of the core flux density at 5.0 GHz).
3.2. Extended emission at 1.7 GHz
In the most sensitive low-frequency VLBI observations (those at 1.7 GHz with large arrays and long observing times), we detect the signature of an extended emission centered at ~15 mas from the core with a peak intensity of ~0.7 mJy beam-1. The position angle of the peak of this extended structure is ~65 ° (northeast direction). We show in Fig. 6 an image with this extended emission. We notice that the intensity of this component is so low that natural weighting of the visibilities1, plus an additional downweight of the longest baselines (a Gaussian taper with half-width at half-maximum, HWHM, of 30 Mλ or lower) is necessary to detect the extended emission in the images. Since it is not detected at the higher frequencies, we can only set a lower absolute value for the spectral index of this extended component, based on the rms of the most sensitive observations at the higher frequencies. We find for this extended component that α < −0.78 (being the flux density S ∝ ν + α).
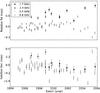 |
Fig. 7 Shifts in right ascension and declination of the peak intensity of M 81*, relative to a fixed position on the sky (see text) and using the center of the SN 1993J radio shell as a position reference. |
The similarity of position angles between the jet components reported in the previous section and this more extended emission points toward a rather straight jet in M 81* or a jet with no strong projected bendings up to a distance of at least ~15 mas (about 0.26 pc of projected linear scale).
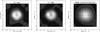 |
Fig. 8 Left and center: CLEAN images of SN 1993J observed at 5.0 GHz and 8.4 GHz, respectively, around September 1996. The color scale runs from black (minimum intensity) to white (maximum intensity). Both images are phase-referenced to M 81*. Right: image cross-correlation (black = −0.02; white = 1.00). Notice the small shift in the correlation peak from the image origin. |
4. Results for multifrequency astrometry
4.1. Frequency-dependent core shifts
In Fig. 7, we show the position of the peak of brightness of M 81* relative to the J2000.0 coordinates α = 09h55m33.173s and δ = 69°3′55.062′′, and with the center of the SN 1993J radio shell as a position reference. These coordinates correspond to the nominal position of M 81* used in the correlation of the data at 5 GHz taken on 30 May 1998. We set the position of the M 81* core at this epoch as our coordinate origin. Therefore, all the other phase-referenced observations correlated using different nominal positions for SN 1993J and/or M 81* were accordingly shifted. In this figure, we show the results for the observations at 8.4, 5.0, 2.3, and 1.7 GHz, which are also given in Table 1. The uncertainties are estimated as the half width at half maximum (HWHM) of the interferometric beam, divided by the dynamic range of the image of SN 1993J corresponding to each epoch. The uncertainties computed in this way are related to the statistical contribution of the image noise in the location of the SN 1993J radio shell. They are also a good estimate of the astrometric precision of compact sources observed with the phase-referencing technique (e.g., Martí-Vidal et al. 2010).
Figure 7 shows the dependence of the position of the peak of brightness of M 81* on the observing frequency, taking the center of the SN 1993J shell (at each frequency) as a position reference. We can use this figure to study the shift of the peak of brightness of M 81* as a function of frequency in the context of the relativistic jet model (e.g., Blandford & Königl 1979; Lobanov 1998). From the time average of the M 81* positions shown in Fig. 7 at each frequency, we derived the relative shifts shown in Table 3 (Row 1) for all pairs of frequencies.
There may be, however, some systematic effects in the data that should be taken into account, or be observationally discarded, before we take the shifts in Table 3 (Row 1) as true shifts of the brightness peak of M 81*. On the one hand, the positions shown in Fig. 7 are obtained from fits of a circularly symmetric shell to the SN 1993J visibilities. The shell of SN 1993J does not have a perfect circular symmetry; there are deviations with respect to a perfect circular source in both the shape of the shell (of the order of 2%) and the intensity distribution inside it (of the order of 20%) (Bartel et al. 2002; Bietenholz et al. 2000; Marcaide et al. 2009; Martí-Vidal et al. 2011a). Moreover, the inhomogeneities in the shell evolve systematically in time. Therefore, and especially for the latest epochs when the supernova is so extended and weak, there could be unexpected systematics in the estimate of the shell center. On the other hand, although the proper motion of SN 1993J in the galactic coordinates might be small (due to the peculiar motion of the supernova progenitor), its integrated effect during more than a decade could still leave a small fingerprint in the position estimates of M 81* (see the next subsection).
Shifts in the M 81* brightness peak for several pairs of observing frequencies.
We decided to apply a different approach to study the frequency-dependent shift of the M 81* brightness peak, which solves, in principle, the drawbacks of using the supernova shell center at each epoch as a position reference. For the subset of epochs where there are quasi-simultaneous observations of the supernova at more than one frequency, we convolved the CLEAN models of SN 1993J at each epoch with beams of the same size, namely, 0.5 times the shell radius at 5 GHz reported in Martí-Vidal et al. (2011a). We then cross-correlated the resulting CLEAN supernova images at different frequencies and, from the peak of the cross-correlation image, we estimated the shift of M 81* between each pair of frequencies. In Fig. 8, we show two images of SN 1993J (at 5 and 8.4 GHz), corresponding to epochs around September 1996, together with their image cross-correlation. The small shift in the correlation peak from the center of the image can be appreciated (~0.2 mas roughly to the west). In Table 3 (Row 2), we present the average shifts of the M 81* brightness peak estimated using this approach. The uncertainties are computed as the standard deviation of the averages, to reflect the natural scatter of the data. For all cases, the error bars are larger than those determined from model fitting. We used a maximum gap of 15 days between two epochs to consider them as quasi-simultaneous2 and also required a minimum dynamic range (i.e., peak intensity over root-mean-square of the residual images) of ten in both SN 1993J and M 81*, to use the data of the corresponding epoch. We notice that the shifts computed from the shell-center estimate (Row 1 in Table 3), which are based on model fitting to the visibilities, are very similar to those computed from the cross-correlation approach (Row 2 of the table), which is a method completely different from model fitting. Both independent methods therefore give consistent results.
We show in Fig. 9 the resulting shifts of the M 81* brightness peak for several pairs of observing frequencies, obtained with the cross-correlation approach. Any relative motion between SN 1993J and M 81* during the whole observing campaign, and any systematics coming from the fit of a circular shell to the evolving supernova structure should not affect the results shown in this figure. From this figure, there is no clear, unambiguous, systematic time evolution in the shifts during the time period covered by our observations, save for the pair of frequencies 1.7−5 GHz at late epochs, with a decrease in relative declination and a slight increase in relative right ascension. This evolution could be indicative of precession of the intensity peak at 5 GHz with respect to the peak at 1.7 GHz. However, these latest astrometry results depend on the images of SN 1993J at late epochs, which are the noisiest. The evidence of jet precession resulting only from Fig. 9 should, thus, be approached with care. However, in Sect. 5.3 we provide evidence of jet precession resulting from the combination of the multifrequency astrometry and the morphological evolution of the jet.
4.2. Position stability of M 81*
Figure 7 shows a frequency-dependent shift in the brightness peak of M 81*. In Table 4, we report the proper motions of those peaks in right ascension, μα, and declination, μδ, considering all the available data at each frequency. The position of the intensity peak at 8.4 GHz is the most stable one, with a proper motion consistent with zero at a level of less than 10 μas year-1. In the other cases but 1.7 GHz, the proper motion fitted in declination is negative and above 3σ.
The proper motion in right ascension is consistent with zero at all frequencies but 5.0 GHz, where a decreasing right ascension of 10 μas year-1 is found at a 3σ level. These results differ from those reported in Martí-Vidal et al. (2011a), based on the same astrometric data3, but converted into separations and position angles (measured north through east). In that publication, we reported that no change in the separation between the intensity peak and our coordinate origin was detected at any frequency, with the exception of the data at 5 GHz beyond July 2001 (i.e., ~3000 days after the explosion of SN 1993J). This is, indeed, a correct result, but a change in separation consistent with zero was then interpreted as a proper motion that is also consistent with zero. Such an interpretation does not consider the contribution of any possible rotation with respect to the reference point, which may contribute, however, to the right-ascension and declination proper motions shown in Table 4. In either case, the small proper motions reported in the present paper translate, at most, into shifts with respect to the SN 1993J shell center of only 1−2% of the shell size at any epoch. These shifts are, indeed, much smaller than the scatter in the positions of the M 81* peak, which is similar to the shell-size uncertainties reported in Martí-Vidal et al. (2011a, see a detailed discussion on this matter, and its potential impact in the reported expansion curve of SN 1993J, in the last paragraph of their Sect. 3.1).
Proper motion of the intensity peak of M 81*.
As a complementary plot, we show in Fig. 10 the evolution on the sky plane of the position of the brightness peak at all frequencies and epochs. On the one hand, different frequencies are plotted using different symbols; on the other hand, and for reasons of clarity, the results at different epochs are plotted using different colors. Although there are some outsiders and the scatter in the data is large, Fig. 10 shows a clear time evolution in the overall orientation of the jet, having smaller position angles (i.e., orientation towards north) at earlier epochs (i.e., reddish colors) compared to those at later epochs (i.e., greenish and blueish colors). The data at 8.4 GHz are only present at early epochs (until November 2000), while data at 1.7 GHz are only present at late epochs (beginning on November 1998).
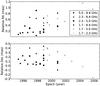 |
Fig. 9 Time evolution of the shift in the intensity peak of M 81* observed at different pairs of frequencies (peak at the lowest frequency referred to the peak at the highest frequency). |
Ω values for the jet of M 81*, derived from different pairs of frequencies.
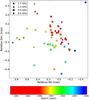 |
Fig. 10 Position of the brightness peak of M 81* at different frequencies (i.e., different symbols) and different epochs (i.e., different colors). The points plotted are taken from columns Δα and Δδ of Table 1. |
5. Discussion
5.1. Spectral-index images
The radio emission from SN 1993J at all frequencies comes from the very same location: the shocked circumstellar region. Therefore, the use of SN 1993J as a position reference, either using the estimated shell center or cross-correlating the images at different frequencies, allows us to build spectral-index images of M 81* free of assuming any co-spatial optically-thin jet component at different frequencies, which is, by far, the most commonly used assumption in the study of chromatic effects in AGN jets (e.g., Kovalev et al. 2008).
We used the shifts in the SN 1993J image cross-correlations (see Sect. 4.1) to align the M 81* images at different epochs and for different pairs of frequencies. The results for two representative epochs are shown in Fig. 11. In each image, we convolved the CLEAN models at both frequencies using the beam corresponding to the lowest frequency. To avoid spurious contributions to the spectral-index maps, we clipped those points in the image with an intensity lower than 2% of the peak intensity at each frequency. In any case, the spectral indices derived in the regions close to the borders of the source should not be taken as reliable, owing to the different sensitivities of the observing arrays at different frequencies and the stronger effect of noise in the regions of the source where the intensity is low.
As previously reported in Bietenholz et al. (2004), the region around the core of M 81* at each frequency has a flat (or even inverted) spectrum, which becomes steeper through the jet as the distance to the core increases. For most of the epochs, the gradient of spectral index is aligned with the direction of the jet.
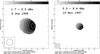 |
Fig. 11 Spectral-index images of M 81* for different pairs of frequencies and epochs. Epoch indicates in this case the average date of observation (Table 1, Col. 1) of the epochs at both frequencies in each image. |
This spectral-index gradient along the jet indicates how the opacity is decreasing with the distance to the jet origin. The same opacity effect indeed explains the core shift between different observing frequencies (reported in Sect. 4.1). In the next section, we discuss in detail the interpretation of our results in the frame of this jet model.
5.2. M 81* and the standard relativistic jet model
If the magnetic field in the jet and the gradient in the electron energy distribution are large enough, synchrotron self-absorption can be relevant. According to the relativistic jet model, the opacity is changing along the relativistic jet and it becomes transparent at a distance from the jet origin that depends on the observing frequency (Blandford & Königl 1979). Therefore, it affects the apparent position of the AGN jet base (or source core) at different frequencies. The dependence of the core position with observing frequency, the core-shift effect as it is known nowadays, was serendipitously discovered by Marcaide & Shapiro (1984) and later found in many sources (e.g., Kovalev et al. 2008). If the strength of the magnetic field in the jet, B, and the particle density, N, can both be described as power laws of the distance to the jet origin, the core shift, Δr, between a given pair of observing frequencies, ν1 and ν2, is given by (Lobanov 1998) 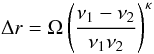 (1)where Ω (which could be interpreted as the core shift normalized to any pair of observing frequencies) depends on the power laws of the decreasing B and N. Larger Ω translate into larger shifts of the cores at different frequencies. If there is particle-field energy equipartition in the jet, then κ = 1. The value of Ω is the same for any pair of frequencies, ν1 and ν2, as long as the power laws that characterize the evolution of B and N hold in the jet region where the cores at both frequencies are located.
The average shift in the brightness peak between two frequencies translates into an estimate of Ω. We show in Table 5 the values of Ω computed for each pair of frequencies shown in Table 3, Row 1, and assuming κ = 1. All values of Ω are compatible, although the uncertainties are quite large in all cases (of course, the uncertainties are larger for pairs of closer frequencies, since the shifts are smaller in these cases; see Eq. (1)). The weighted average of Ω for all the frequency pairs is Ω = 1.75 ± 0.20 mas GHz.
5.2.1. Position of the central AGN engine
Bietenholz et al. (2000) estimated the location of the central engine of M 81* based on the most stable position of their geometrical model of M 81*, referenced to the shell center of SN 1993J. Later, Bietenholz et al. (2004) followed an independent approach to determine the core position, based on multifrequency relative astrometry also referenced to the shell center of SN 1993J. Both approaches resulted in compatible estimates of the location of the central engine in M 81*.
Separation between the jet origin (i.e., ν → ∞) and the core observed at each frequency.
From the average value of Ω reported in the previous section, we can estimate the location of the jet origin of M 81*, based on a larger dataset than used in Bietenholz et al. (2004), and using an independent approach (i.e., using Eq. (1) to find the jet origin). From Eq. (1), and assuming κ = 1, it can be shown that the separation from the jet origin (i.e., the central engine of M 81*) to the core observed at a given frequency ν is
 which translates into the separation estimates given in Table 6. The position of the jet origin obtained from our approach (Table 6) is in excellent agreement with the position reported in Bietenholz et al. (2000, 2004).
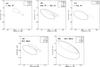 |
Fig. 12 Astrometric reconstruction of the jet structure. The ellipses are contours of the Gaussians with the parameters given in Table 7. These parameters are the epoch-average of the model-fitting results (Table 1) for different time ranges: a) up to June 1997; b) June 1997 through June 2001; c) from June 2001 onwards; and d) all epochs; in a)–d) the contours shown correspond to 0.5 times the FWHM; e) is equivalent to d), but the contours shown correspond to the FWHM. The coordinate origin in each figure corresponds to the centroid of the Gaussian at 5 GHz in b). |
5.2.2. Magnetic field in the jet and black-hole mass
Since we know the distance to M 81* (3.63 Mpc; Freedman et al. 1994), we can compute the normalized core shift on a linear scale: Ω ~ 0.031 pc GHz. This value can be used (together with the distances from the cores to the central engine of the AGN, reported in the previous subsection) to estimate the magnetic field in the jet assuming particle-field energy equipartition (see, e.g., Eq. (10) in Lobanov 1998). For that estimate, we also need to know the viewing angle of the jet (~14 degrees; Devereux et al. 2003) and its opening angle (a projected value of ~17 degrees; see Sect. 5.4).
Using Eq. (10) of Lobanov (1998), the estimated magnetic field is 7, 10, 21, and 34 mG in the region of the brightness peak at 1.7, 2.3, 5.0, and 8.4 GHz, respectively. (The magnetic field is assumed to be inversely proportional to the distance to the AGN central engine.) Since these are just rough estimates, only their order of magnitude is considered in our discussion.
We notice that these estimates of the magnetic field only depend on the source geometry and the differential astrometry (i.e., the core shift). It is intriguing that these estimates are several orders of magnitude lower than the magnetic fields derived from the modeling of the M 81* spectrum (tens of Gauss if the inverted spectrum is optically thick; see Reuter & Lesch 1996). Much lower magnetic fields can be matched to the spectrum if the emission is assumed to be produced by a mono-energetic population of electrons (hence to be optically thin; see Reuter & Lesch 1996), but such a scenario is at odds with our self-absorption interpretation of the observed core shift.
Furthermore, as discussed in Lobanov (1998), the magnetic field at 1 pc from the central AGN engine can be used to estimate the mass of the black hole, by direct comparison to models of magnetically-driven accretion disks (Field & Rogers 1993) and black holes surrounded by strong magnetic fields (Kardashev 1995). Using this approach, the mass of the black hole can be approximated as
 where B1 is the magnetic field at 1 pc from the AGN engine. With this equation, we estimate a mass of ~2 × 10⁷ M⊙. This estimate is within the same order of magnitude as the value of
  M⊙ reported in Devereux et al. (2003), based on spectroscopic observations of the central rotating disk of gas, and the value of
  M⊙ reported in Schorr Müller et al. (2011), based on the stellar-velocity dispersion of the bulge. As a result, our measured core shifts, the resulting magnetic field in the jet, and the derived black-hole mass are all self-consistent in the frame of the standard jet-interaction model.
5.3. Jet precession
The model-fitting results shown in Fig. 2 (right) hint at position angles of the core Gaussians that are systematically different at different epochs and frequencies. From 1994 to June 2001, the position angle seems to increase from ~50 degrees to ~70 degrees. (This increase in position angle with time seems to be clearer from June 1997 onwards, since the data is less spread during the flare from June 1997 to Jun 2001.) The change in position angle seems to slow down at later epochs or, even, to slightly reverse.
If the major axis of the fitting Gaussian is aligned to the local direction of the jet in the region where the peak emission is produced (the most straightforward interpretation of our simplified geometrical model), the different position angles at different epochs point to clear evidence of an (evolving) bent jet. In the following subsections, we analyze the morphological evolution found in M 81* in more detail and discuss its interpretation as due to a precessing jet.
5.3.1. Evidence of precession from the multifrequency astrometry
We computed the time average of the fitted Gaussian parameters shown in Figs. 2 and 3 for all frequencies and for different time ranges. The results are given in Table 7 (the uncertainties are computed as the standard deviations in the averages), together with the average, for the same epochs, of the peak positions reported in Sect. 4.2. The quantities given in Table 7 were used to generate Fig. 12. Thus, it is a schematic representation of the jet structure, based on the astrometry results reported in Sect. 4.2 and the model-fitting results reported in Sect. 3. For clarity reasons, the contours shown at each frequency correspond to 0.5 times the full width at half maximum (FWHM) of the Gaussians (Fig. 12a–d).
Epoch-average of Gaussian model parameters.
A first conclusion from Fig. 12 is that, no matter the epoch range used in the average, the fitted Gaussians at 1.7 GHz are always missaligned (towards the southeast) with respect to the Gaussians at the other frequencies. Another conclusion is that the position and inclination of the average Gaussians at different frequencies seems to depend on the time range used in the average. Before June 1997, the major axes of the Gaussians seem to be well aligned with the overall direction of the jet (Fig. 12a); however, between June 1997 and June 2001 (the time range where higher peak flux densities are obtained at higher frequencies, see Sect. 3), the Gaussians are shifted towards the east. In other words, the position angle of the overall jet increases with time.
This increase in position angle with time is directly related to the decrease of Δδ, shown in Table 7, at 1.7, 2.3, and 5.0 GHz. It must be noticed that the uncertainties in Δδ are similar to the changes in Δδ for the different epoch ranges used in the average, so the increase in the overall position angle of the M 81* jet seen in Fig. 12 (i.e., taken from Table 7) might not be statistically significant. Nevertheless, we must also notice that a decrease with time in Δδ is observed in all cases at 1.7, 2.3, and 5.0 GHz (the increase at 8.4 GHz is only 0.16σ), thus giving more statistical significance to the hypothesis of an increasing position angle. We elaborate on this by assuming that the null hypothesis (i.e., a jet with a non-evolving position angle) is true. The average in Δδ at all frequencies, Av(Δδ), computed from the results shown in Table 7, is 0.122 ± 0.056 mas. Therefore, the Student’s ratio (see, e.g., Mandel 1964) is
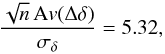 where n is the number of pairs of Δδ estimates (6 in our case) and σδ is the standard deviation of Δδ. The Student’s ratio is the deviation (in units of σ) from the average value predicted using the null hypothesis. Higher values of this ratio translate into lower probabilities for the null hypothesis. If Δδ follows a Gaussian distribution, our set of changes in Δδ follows a Student’s distribution, so the likelihood of the null hypothesis can be computed from the Student’s density function using our estimate of the Student’s ratio. The likelihood of the null hypothesis (i.e., a nonevolving jet orientation) turns out to be 0.08%. The likelihood of the hypothesis of a jet with an increasing position angle is then 99.92%. Hence, our astrometry results can be considered as strong evidence of an evolving position angle of the jet of M 81*. The fitted proper motions shown in Table 4 also point, indeed, to an increasing position angle in the jet, since it is oriented in the northeast direction and the proper motions in declination are negative at 1.7, 2.3, and 5.0 GHz. Moreover, from their VSOP observations at 5 GHz, Bartel & Bietenholz (2000) found hints of a helical structure in the M 81* jet, which can be taken as a further support for a changing jet orientation.
Therefore, we find a relation between the increasing position angles of the model core Gaussians (Fig. 2 right) and the increasing position angle of the overall jet, as seen from the differential astrometry at different frequencies (i.e., Figs. 12a, b and Table 7). These results suggest a changing orientation in the jet of M 81* (e.g., a precessing jet). There is, indeed, a possible additional relation between the changing orientation of the jet and the increase in the peak flux density observed at high frequencies (Fig. 2 left). A jet with an evolving orientation might help for explaining the peak-intensity evolution shown in Fig. 2 as due, for instance, to changes in the relativistic Doppler boosting of the synchrotron emission by the plasma, as it travels through the jet, or to the interaction of the jet plasma with inhomogeneities in the surrounding medium as the jet orientation evolves. In both cases, a periodic evolution in the flux density of M 81* would be expected.
Indeed, periodic flux-density variability (with periods up to a few years) found in several AGN have been interpreted as related to jet precession (e.g., the Seyfert galaxy IIIZw2, Brunthaler et al. 2005; or quasar B0605-085, Kudryavtseva et al. 2011). In Kudryavtseva et al. (2011), the variability (with a period 7.9 ± 0.5 years) could be related to the helical path of a jet feature. The period reported for B0605-085 is similar to the precession period that we report for M 81* in Sect. 5.3.2.
It is intriguing that the flux-density flare in M 81* at 5.0 and 8.4 GHz is not present at 1.7 GHz. However, there is a hint of higher flux densities at 1.7 GHz before year 2001 (values around 0.11 Jy) than after year 2001 (values around 0.08 Jy; see Fig. 2). This increase in flux density at 1.7 GHz is not as strong as the increases at 5.0 and 8.4 GHz (which are of about a factor 2) and could be indicative, for instance, of a smaller Doppler boosting at 1.7 GHz due to a bent jet (i.e., the viewing angle of the part of the jet with maximum emission at 1.7 GHz would be larger). Indeed, the misalignment of the core at 1.7 GHz with respect to those at the higher frequencies (see Fig. 12) might also be related to such a jet bending. This suggests a strong bend in the jet orientation within a region of ~0.75−1.0 mas from the jet origin (2600-3600 AU of projected linear scale). Such a bending, however, would conflict with the straight jet reported in Sects. 3.1 and 3.2, unless the bending is corrected at distances from the jet origin farther than for the core at 1.7 GHz.
Finally, in Fig. 12e we show the average of the fitted models for all epochs, but plotting the contours of the Gaussians at their FWHM. We can compare this figure directly to Fig. 2 of Bietenholz et al. (2004). The similarity between both figures indicates similar astrometric results in both works. It must be noticed that the FWHM of the average Gaussians at 2.3, 5.0, and 8.4 GHz are remarkably well aligned, being the location of the southern side of their major axes – associated with the core region at the different frequencies – almost coincident (as reported in Bietenholz et al. 2004).
5.3.2. Evidence of precession from the evolving inclination of the core
We can also study the evolution in the position angles of the fitted core Gaussians at each frequency. Although the spread in the results shown in Fig. 2 (right) is large, we notice that the results corresponding to epochs later than year 1997 are less scattered than those at earlier epochs. This is not surprising, since the overall quality of the data and the sensitivity of the interferometric arrays (i.e., amount of available radio telescopes, total observing time, and/or quality of the receiving systems) was improved year after year. If we focus on the subset of epochs at 1.7 and 5 GHz (i.e., the frequencies with the best array sensitivities) taken after year 1997, we end up with the results shown in Fig. 13. Although we notice that there is a certain risk of overinterpreting these results, an oscillating trend in the position angles at 5 GHz seems clear. In the same figure, we show a fitting phenomenological model consisting of a sinusoidal change of the position angle plus a small drift, i.e., 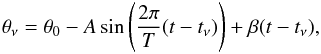 (2)where θν is the position angle of the core Gaussian at frequency ν, t the observing epoch, A is the amplitude of oscillation, T the period, tν is the reference time at frequency ν, and β a small position-angle drift. We notice that the only frequency-dependent parameter in this simple model is tν. We give in Table 8 the best-fit values of the model parameters of Eq. (2). A simple interpretation of this model is a precessing jet of period T plus a frequency-dependent core shift (which accounts for tν). We notice that Fig. 13 is compatible with the results shown in Figs. 12 and 10 in the frame of our jet-precession model, since the increase in position angle of the core Gaussian at 5 GHz, owing to the sinusoidal evolution shown in Fig. 13, begins around the end of year 1997 and stops around the end of year 2001.
Thus, this increase in position angle would account for the rotation of the overall jet to the East (Fig. 12b). If our interpretation of Fig. 13 is correct, and the long flare at 5 GHz and 8.4 GHz shown in Fig. 2 (left) is related to the jet precession, we would expect to see further similar flares around years 2006 and 2015.
Similar oscillating trends in the position angles of AGN jets have been found. In particular, Lobanov & Roland (2005) found an oscillation period of 9.5 years in the inner part of the 3C 345 jet, which was modeled in addition to a long-term drift of 0.4 deg year-1. These results are very similar to the fitted parameters shown in Table 8, although the amplitude of oscillation in the case of 3C 345 is around 40 degrees, much larger than that in M 81*. These authors could successfully model their set of 22 GHz VLBI observations and multiband lightcurves with a binary black-hole model plus a precessing accretion disk around the primary. The period and long-term drift in the evolution of the position angle of the core of M 81 reported here are comparable to those reported by Lobanov & Roland (2005) for 3C 345, but this is the first time that such behavior has been detected in an LLAGN. In addition, we have been able to relate the (multifrequency) changing position angle of the core Gaussians to the (multifrequency) evolving core positions in the frame of the host galaxy, via the astrometry referred to SN 1993J.
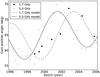 |
Fig. 13 Position angle of the core Gaussians at 1.7 and 5 GHz, observed since year 1996 (typical uncertainties are given in Table 2). Predictions of our simplified precession model (see Eq. (2) and Table 8) are shown in continuous and dashed trace. |
5.4. Opening angle of the jet and precession tilt
Another conclusion that can be extracted from Fig. 12 is that the jet becomes progressively wider as the distance to the core increases, indicating a conic-like section in its longitudinal direction. The (projected) opening angle of the jet, estimated from the contours shown in Fig. 12a, is ~17 degrees. Since this angle has been derived from the projection of the jet on the sky plane, it is an upper limit to the true opening angle of the jet.
If we assume that the jet is almost perpendicular to the plane of the rotating parsec-scale disc of gas reported in Devereux et al. (2003), the jet viewing angle is ~14 degrees. Hence, the true opening angle of the jet would be ~4 degrees.
In the scenario of a precessing jet, the angle between the precession axis and the jet (i.e., the tilt angle of the jet) would be around a half of the total change in position angle of the major axes of the fitted core Gaussians (which is ~7 degrees, see the value of parameter A in Table 8). Therefore, the real tilt angle in the precession (i.e., correcting for the jet viewing angle) would be ~1 degree.
6. Conclusions
We have reported on a set of global VLBI observations of the AGN in M81 (M 81*), performed between years 1993 and 2005 at the frequencies of 1.7, 2.3, 5.0, and 8.4 GHz. We studied the morphological evolution of the source and its differential astrometry with respect to SN 1993J (a stable position reference in the galactic frame of M 81).
The source consists, at all frequencies, of a slightly resolved core component plus a weak jet extension in the northeast direction (position angle of about 65 degrees). The core component has an increasing size with decreasing frequency (from ~0.5 mas at 8.4 GHz to ~2.2 mas at 1.7 GHz). At 1.7 GHz we also find a more extended emission located at ~15 mas from the core and at a position angle of ~65 degrees. This extended emission hints at a rather straight jet in M 81* at least up to 0.26 pc (1.1 pc) of projected (unprojected) distance to the core. The core components at all frequencies are elongated roughly in the direction of the jet extension and show evidence of an increasing position angle.
The evolution of the peak flux density of the core shows a clear long-term trend at 5.0 and 8.4 GHz, with an increase starting around June 1997, a maximum reached around July 1998, and a decrease ending around June 2001. The flux-density variability during this long-term flare is about 100% with respect to that in the quiescent stage.
From the astrometric study, we find a shift in the brightness peak of M 81* towards the southwest direction with increasing frequency, as previously reported in Bietenholz et al. (2004). We compared these shifts with the predictions of the relativistic jet model, assuming a power-law behavior for the decay in the magnetic field and the particle density distribution along the jet. We used the Lobanov (1998) model to estimate the position of the central engine of M 81* (i.e., the origin of the jet), relative to the average position of the brightness peaks of our VLBI images. The estimated position of the jet origin is in excellent agreement with the one reported in previous publications using different approaches (Bietenholz et al. 2000, 2004). We also used the model of Lobanov (1998) to estimate the magnetic field in the jet and the mass of the central black hole. We obtained magnetic fields of a few milli-Gauss at distances of a fraction of a parsec from the central engine of the AGN. These values are much lower than those needed to fit the (self-absorption dominated) inverted spectrum of M 81*. However, we obtained a black-hole mass of ~2 × 10⁷ M⊙, comparable to previously reported estimates using different approaches.
From the spectral-index images of M 81*, we find a region with inverted spectrum (typical values of α between 0.5 and 1.5) around the intensity peak at each frequency. The spectrum becomes steeper along the jet. This behavior, together with the multiwavelength astrometric results, agrees with the relativistic jet model.
The position of the peak intensity at 8.4 GHz is very stable in the frame of the host galaxy, with a proper motion consistent with zero to better than 10 μas year-1. The positions of the peaks at the other frequencies are less stable, and systematically evolve towards the south (i.e., larger position angles) at a rate of 10, 76, and 34 μas year-1 at 1.7, 2.3, and 5.0 GHz, respectively. We interpret these results as strong evidence of jet precession towards the south.
There is also a relation between the evolution in the relative astrometry among the peaks at different frequencies and the evolving inclination of the cores, as fitted with elliptical Gaussians. This relation lends further support to an evolving orientation of the overall jet of M 81*. The long-term variability found in the peak flux densities at 5.0 and 8.4 GHz also seems related to the evolving jet orientation. In such a case, if the changing orientation of the jet is periodic (i.e., the jet is precessing, so that its position angle will eventually turn northward after reaching its maximum value, around 70 degrees, and then turn back eastward), we predict that the flux density of M 81* at the higher frequencies will eventually increase and follow a light curve similar to our observations by the next 10 years. Thus, a continued monitoring of the flux density and jet structure evolution of this LLAGN will be necessary to further confirm (and, eventually, better constrain) our precession model.
An increase in the accretion rate of the central engine and its later correlation with the jet particle density seem unlikely to explain the light curve of Fig. 2 (left), since it would not explain the simultaneous change in the jet orientation. Therefore, one would be tempted to think of a correlation between the flare and the evolving jet orientation, which would, in principle, imply the periodic generation of similar long-term flares in the future, as in the case of B0605-085 (Kudryavtseva et al. 2011).
From the model of Martí-Vidal et al. (2011a), the expansion of the supernova during 15 days is only ~30 μas on day 500, and less at later times, which is well below the VLBI resolution for all observation frequencies reported here.
Acknowledgments
I.M.V. is a fellow of the Alexander von Humboldt foundation in Germany. M.A.P.T. acknowledges support by the Spanish Ministry of Education and Science (MEC), through grant AYA2006-14986-C02-01, and by the Consejería de Innovación, Ciencia y Empresa of Junta de Andalucía, through grants FQM-1747 and TIC-126. Partial support from Spanish grants AYA2009-13036-C02-02, AYA2009-13036-C02-02, and Prometeo 2009/104 is also acknowledged. The National Radio Astronomy Observatory is a facility of the National Science Foundation operated under cooperative agreement by Associated Universities, Inc. The European VLBI Network is a joint facility of European, Chinese, South African, and other radio astronomy institutes funded by their national research councils.
References
- Alef, W., & Porcas, R. W. 1986, A&A, 168, 365 [NASA ADS] [Google Scholar]
- Bartel, N., & Bietenholz, M. F. 2000, in Proc. VSOP Symposium, ed. H. Hirabayashi, P. G. Edwards, & D. W. Murphy (Sagamihara: Institute of Space and Astronautical Science), 17 [Google Scholar]
- Bartel, N., Bietenholz, M. F., Rupen, M. P., et al. 2002, ApJ, 581, 404 [NASA ADS] [CrossRef] [Google Scholar]
- Bietenholz, M. F., Bartel, N., & Rupen, M. P. 2000, ApJ, 532, 895 [NASA ADS] [CrossRef] [Google Scholar]
- Bietenholz, M. F., Bartel, N., & Rupen, M. P. 2003, ApJ, 597, 374 [NASA ADS] [CrossRef] [Google Scholar]
- Bietenholz, M. F., Bartel, N., & Rupen, M. P. 2004, ApJ, 615, 173 [NASA ADS] [CrossRef] [Google Scholar]
- Blandford, R. D., & Konigl, A. 1979, ApJ, 232, 34 [NASA ADS] [CrossRef] [Google Scholar]
- Brunthaler, A., Falcke, H., Bower, G. C., et al. 2005, A&A, 435, 497 [NASA ADS] [CrossRef] [EDP Sciences] [Google Scholar]
- Devereux, N., Ford, H., Tsvetanov, Z., & Jacoby, G. 2003, AJ, 125, 1226 [NASA ADS] [CrossRef] [Google Scholar]
- Duschl, W. J., & Lesch, H. 1994, A&A, 286, 431 [NASA ADS] [Google Scholar]
- Falcke, H., Lehár, J., Barvainis, R., Nagar, N. M., & Wilson, A. S. 2001, in Probing the Physics of Active Galactic Nuclei, ASP Conf. Proc., 224, 265 [NASA ADS] [Google Scholar]
- Field, G. B., & Rogers, R. D. 1993, ApJ, 403, 94 [NASA ADS] [CrossRef] [Google Scholar]
- Freedman, W. L., Hughes, S. M., Madore, B. F., et al. 1994, ApJ, 427, 628 [NASA ADS] [CrossRef] [Google Scholar]
- Ho, L. C., Filippenko, A. V., & Sargent, W. L. W. 1996, ApJ, 462, 183 [NASA ADS] [CrossRef] [Google Scholar]
- Ho, L. C., van Dyk, S. D., Pooley, G. G., et al. 1999, AJ, 118, 843 [NASA ADS] [CrossRef] [Google Scholar]
- Ishisaki, Y., Makishima, K., Iyomoto, N., et al. 1996, PASJ, 48, 237 [NASA ADS] [Google Scholar]
- Kardashev, N. S. 1995, MNRAS, 276, 515 [NASA ADS] [Google Scholar]
- Kettenis, M., van Langevelde, H. J., Reynolds, C., & Cotton, B. 2006, Astronomical Data Analysis Software and Systems XV, 351, 497 [NASA ADS] [Google Scholar]
- Kovalev, Y. Y., Lobanov, A. P., Pushkarev, A. B., & Zensus, J. A. 2008, A&A, 483, 759 [NASA ADS] [CrossRef] [EDP Sciences] [Google Scholar]
- Kudryavtseva, N. A., Britzen, S., Witzel, A., et al. 2011, A&A, 526, A51 [NASA ADS] [CrossRef] [EDP Sciences] [Google Scholar]
- Lobanov, A. P. 1998, A&A, 330, 79 [NASA ADS] [Google Scholar]
- Lobanov, A. P., & Roland, J. 2005, A&A, 431, 831 [NASA ADS] [CrossRef] [EDP Sciences] [Google Scholar]
- Mandel, J. 1964, The Statistical Analysis of Experimental Data (New York: Dover Publications Inc.) [Google Scholar]
- Marcaide, J. M., & Shapiro, I. I. 1984, ApJ, 276, 56 [NASA ADS] [CrossRef] [Google Scholar]
- Marcaide, J. M., Martí-Vidal, I., Alberdi, A., et al. 2009, A&A, 505, 927 [NASA ADS] [CrossRef] [EDP Sciences] [Google Scholar]
- Markoff, S., Nowak, M., Young, A., et al. 2008, ApJ, 681, 905 [NASA ADS] [CrossRef] [Google Scholar]
- Marscher, A. P., Jorstad, S., Gómez, J. L., et al. 2002, Nature, 417, 625 [NASA ADS] [CrossRef] [PubMed] [Google Scholar]
- Martí-Vidal, I., Guirado, J. C., Jiménez-Monferrer, S., & Marcaide, J. M. 2010, A&A, 517, A70 [NASA ADS] [CrossRef] [EDP Sciences] [Google Scholar]
- Martí-Vidal, I., Marcaide, J. M., Alberdi, A., et al. 2011a, A&A, 526, A142 [NASA ADS] [CrossRef] [EDP Sciences] [Google Scholar]
- Martí-Vidal, I., Marcaide, J. M., Alberdi, A., et al. 2011b, A&A, 526, A143 [NASA ADS] [CrossRef] [EDP Sciences] [Google Scholar]
- Merloni, A., Heinz, S., & Di Matteo, T. 2003, MNRAS, 345, 1057 [NASA ADS] [CrossRef] [Google Scholar]
- Mirabel, I. F., & Rodríguez, L. F. 1998, Nature, 392, 673 [NASA ADS] [CrossRef] [Google Scholar]
- Miller, J. M., Nowak, M., Markoff, S., et al. 2010, ApJ, 720, 1033 [NASA ADS] [CrossRef] [Google Scholar]
- Mundell, C. G., Ferruit, P., Nagar, N., & Wilson, A. S. 2009, ApJ, 703, 802 [NASA ADS] [CrossRef] [Google Scholar]
- Nagar, N. M., Falcke, H., Wilson, A. S., & Ulvestad, J. S. 2002, A&A, 392, 53 [NASA ADS] [CrossRef] [EDP Sciences] [Google Scholar]
- Page, M. J., Soria, R., Zane, et al. 2004, A&A, 422, 77 [NASA ADS] [CrossRef] [EDP Sciences] [Google Scholar]
- Pollack, L. K., Taylor, G. B., & Zavala, R. T. 2003, ApJ, 589, 733 [NASA ADS] [CrossRef] [Google Scholar]
- Reuter, H.-P., & Lesch, H. 1996, A&A, 310, L5 [NASA ADS] [Google Scholar]
- Reynolds, C. S., Nowak, M., Markoff, S., et al. 2009, ApJ, 691, 1159 [NASA ADS] [CrossRef] [Google Scholar]
- Ros, E., & Pérez-Torres, M. A. 2008, in The role of VLBI in the Golden Age for Radio Astronomy, PoS, IX EVN Symp., 090 [Google Scholar]
- Shepherd, M. C., Pearson, T. J., & Taylor, G. B. 1995, BAAS, 27, 2, 903 [Google Scholar]
- Schödel, R., Krips, M., & Markoff, S. 2007, A&A, 463, 551 [NASA ADS] [CrossRef] [EDP Sciences] [Google Scholar]
- Schorr Müller, A., Storchi-Bergmann, T., Riffel, R. A., et al. 2011, MNRAS, 413, 149 [NASA ADS] [CrossRef] [Google Scholar]
- Weiler, K. W., Williams, C. L., Panagia, N., et al. 2007, ApJ, 671, 1959 [NASA ADS] [CrossRef] [Google Scholar]
All Tables
Results of astrometry and model fitting of M 81*. In the cases when it was not possible to perform a reliable astrometry (due to poor uv-coverage, too noisy data, or both), we added “–”.
Separation between the jet origin (i.e., ν → ∞) and the core observed at each frequency.
All Figures
|
Fig. 1 Images of M 81* obtained from the VLBI epochs at a) 1.6 GHz, b) 2.3 GHz, c) 5.0 GHz, and d) 8.4 GHz observed around mid November 2000 (see Table 1). Contours are located at 3, |
| In the text | |
|
Fig. 2 Peak flux density (left) and position angle (right) of the elliptical Gaussians used to model the core emission of M 81* at all frequencies (see Table 1 and text). Typical uncertainties are given in Table 2. |
| In the text | |
|
Fig. 3 Major axis (left) and axis ratio (right), i.e., minor axis in units of major axis, of the elliptical Gaussians used to model the core emission of M 81* at all frequencies (see Table 1 and text). Typical uncertainties are given in Table 2. |
| In the text | |
|
Fig. 4 Separation from the core (left) and orientation relative to the core (right) of the jet extension of M 81* at all frequencies. |
| In the text | |
|
Fig. 5 Flux density of the M 81* jet extension relative to the peak intensity of the core. |
| In the text | |
|
Fig. 6 Image of M 81* at 1.7 GHz obtained from the VLBI observations at epoch 2000 November 20 (see Table 1). The FWHM of the convolving beam is shown in the bottom left corner. Natural weighting and a Gaussian taper in Fourier space have been applied (see text). |
| In the text | |
|
Fig. 7 Shifts in right ascension and declination of the peak intensity of M 81*, relative to a fixed position on the sky (see text) and using the center of the SN 1993J radio shell as a position reference. |
| In the text | |
|
Fig. 8 Left and center: CLEAN images of SN 1993J observed at 5.0 GHz and 8.4 GHz, respectively, around September 1996. The color scale runs from black (minimum intensity) to white (maximum intensity). Both images are phase-referenced to M 81*. Right: image cross-correlation (black = −0.02; white = 1.00). Notice the small shift in the correlation peak from the image origin. |
| In the text | |
|
Fig. 9 Time evolution of the shift in the intensity peak of M 81* observed at different pairs of frequencies (peak at the lowest frequency referred to the peak at the highest frequency). |
| In the text | |
|
Fig. 10 Position of the brightness peak of M 81* at different frequencies (i.e., different symbols) and different epochs (i.e., different colors). The points plotted are taken from columns Δα and Δδ of Table 1. |
| In the text | |
|
Fig. 11 Spectral-index images of M 81* for different pairs of frequencies and epochs. Epoch indicates in this case the average date of observation (Table 1, Col. 1) of the epochs at both frequencies in each image. |
| In the text | |
|
Fig. 12 Astrometric reconstruction of the jet structure. The ellipses are contours of the Gaussians with the parameters given in Table 7. These parameters are the epoch-average of the model-fitting results (Table 1) for different time ranges: a) up to June 1997; b) June 1997 through June 2001; c) from June 2001 onwards; and d) all epochs; in a)–d) the contours shown correspond to 0.5 times the FWHM; e) is equivalent to d), but the contours shown correspond to the FWHM. The coordinate origin in each figure corresponds to the centroid of the Gaussian at 5 GHz in b). |
| In the text | |
|
Fig. 13 Position angle of the core Gaussians at 1.7 and 5 GHz, observed since year 1996 (typical uncertainties are given in Table 2). Predictions of our simplified precession model (see Eq. (2) and Table 8) are shown in continuous and dashed trace. |
| In the text | |
Current usage metrics show cumulative count of Article Views (full-text article views including HTML views, PDF and ePub downloads, according to the available data) and Abstracts Views on Vision4Press platform.
Data correspond to usage on the plateform after 2015. The current usage metrics is available 48-96 hours after online publication and is updated daily on week days.
Initial download of the metrics may take a while.