Free Access
Fig. 1
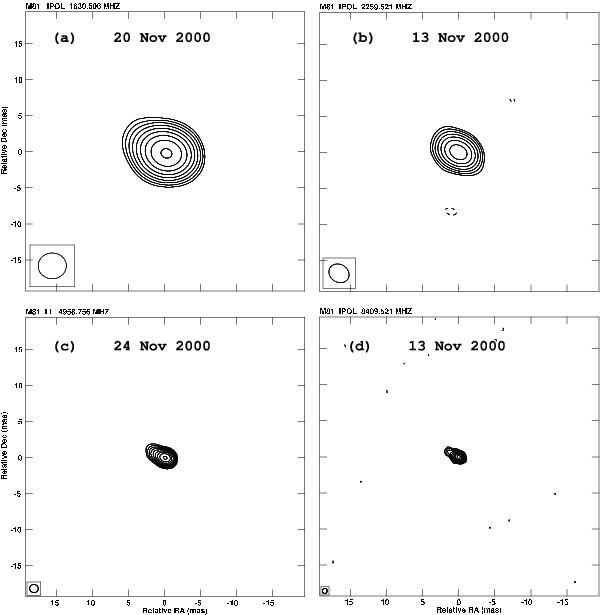
Images of M 81* obtained from the VLBI epochs at a) 1.6 GHz, b) 2.3 GHz, c) 5.0 GHz, and d) 8.4 GHz observed around mid November 2000 (see Table 1). Contours are located at 3,  , 9, ... of the rms of the images. The FWHM of the convolving beam is shown in the bottom left corner of each image.
Current usage metrics show cumulative count of Article Views (full-text article views including HTML views, PDF and ePub downloads, according to the available data) and Abstracts Views on Vision4Press platform.
Data correspond to usage on the plateform after 2015. The current usage metrics is available 48-96 hours after online publication and is updated daily on week days.
Initial download of the metrics may take a while.