Fig. 8
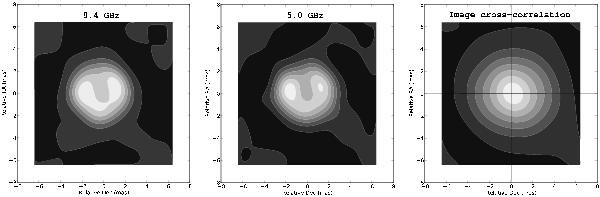
Left and center: CLEAN images of SN 1993J observed at 5.0 GHz and 8.4 GHz, respectively, around September 1996. The color scale runs from black (minimum intensity) to white (maximum intensity). Both images are phase-referenced to M 81*. Right: image cross-correlation (black = −0.02; white = 1.00). Notice the small shift in the correlation peak from the image origin.
Current usage metrics show cumulative count of Article Views (full-text article views including HTML views, PDF and ePub downloads, according to the available data) and Abstracts Views on Vision4Press platform.
Data correspond to usage on the plateform after 2015. The current usage metrics is available 48-96 hours after online publication and is updated daily on week days.
Initial download of the metrics may take a while.