Fig. 4
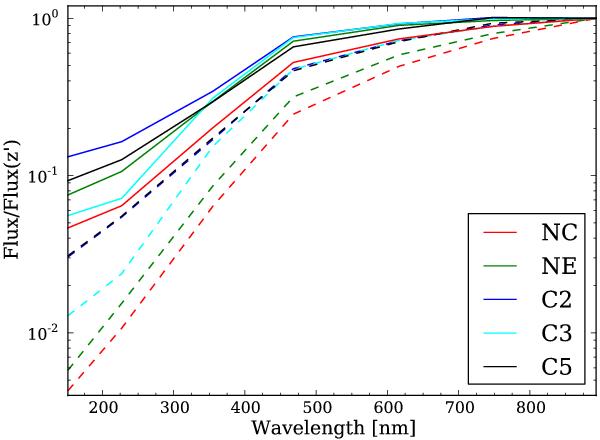
SED of all regions normalised to the flux density in the z′ band. The red, green, blue, cyan and black lines represent respectively the NC, NE, C2, C3 and C5 regions. The dashed lines represent the SED not corrected for the internal extinction whereas the solid lines represent the SED corrected for the extinction assuming a starburst curve (Calzetti 2001) and the extinction values listed in Table 5. Note that the extinguished SEDs of C2 and C5 are similar.
Current usage metrics show cumulative count of Article Views (full-text article views including HTML views, PDF and ePub downloads, according to the available data) and Abstracts Views on Vision4Press platform.
Data correspond to usage on the plateform after 2015. The current usage metrics is available 48-96 hours after online publication and is updated daily on week days.
Initial download of the metrics may take a while.