Fig. 1
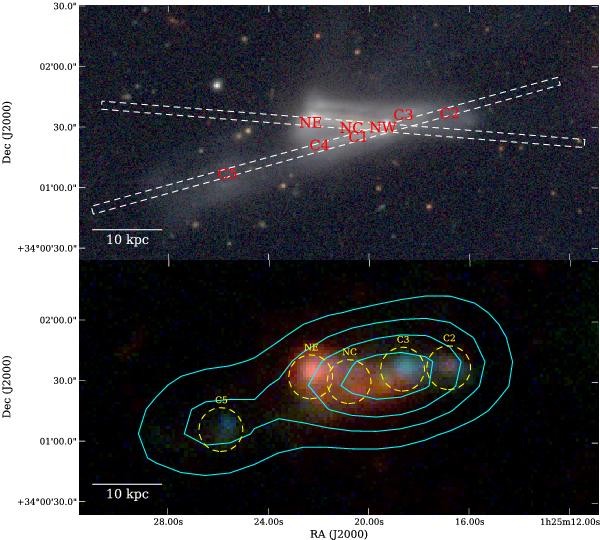
Top: optical image in g′ (blue channel), r′ (green channel) and i′ (red channel) bands. The regions of interest listed in Table 1 are indicated with a red label. The white dashed rectangles represent the two long slits used for optical spectroscopy. Bottom: FUV (blue channel), NUV (green channel) and 24 μm (red channel). The contours in cyan trace the HI column density. The yellow dashed circles represent the CO(1–0) beams and the area in which fluxes have been measured. Due to the large CO beams, not all regions of interest can have their CO emission detected separately.
Current usage metrics show cumulative count of Article Views (full-text article views including HTML views, PDF and ePub downloads, according to the available data) and Abstracts Views on Vision4Press platform.
Data correspond to usage on the plateform after 2015. The current usage metrics is available 48-96 hours after online publication and is updated daily on week days.
Initial download of the metrics may take a while.