Free Access
Fig. 7

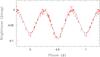
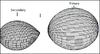
Top: photometry of LZ Cep from Hipparcos satellite. The red triangles are the observational data. A period of ~ 3.07 d is used. The solid line corresponds to the theoretical light curve fit with the parameters listed in Table 3. Bottom: a 3D view of both stars when the secondary star fills up its Roche lobe.
This figure is made of several images, please see below:
Current usage metrics show cumulative count of Article Views (full-text article views including HTML views, PDF and ePub downloads, according to the available data) and Abstracts Views on Vision4Press platform.
Data correspond to usage on the plateform after 2015. The current usage metrics is available 48-96 hours after online publication and is updated daily on week days.
Initial download of the metrics may take a while.