| Issue |
A&A
Volume 533, September 2011
|
|
|---|---|---|
| Article Number | A30 | |
| Number of page(s) | 13 | |
| Section | Stellar structure and evolution | |
| DOI | https://doi.org/10.1051/0004-6361/201116646 | |
| Published online | 24 August 2011 | |
Starspots on the fastest rotators in the β Pictoris moving group⋆
1
Instituto de Astrofísica de Canarias,
38205
La Laguna, Tenerife
Spain
e-mail: david.garcia@gtc.iac.es
2
Grantecan CALP, 38712 Breña Baja, La Palma, Spain
3
Harvard-Smithsonian CfA, 60 Garden Street,
Cambridge, MA
02138,
USA
4
INAF - Osservatorio Astrofisico di Catania, via S. Sofia
78, 95123
Catania,
Italy
5
South African Astronomical Observatory, PO Box 9, Observatory
7935, Cape Town,
South Africa
6
Research School of Astronomy and Astrophysics, Australian National
University, Canberra, ACT,
Australia
7 Armagh Observatory, College Hill, Armagh BT61 9DG Northern
Ireland
8
Department of Physics, University of the Western
Cape, Private Bag
X17, Bellville
7535, South
Africa
Received: 4 February 2011
Accepted: 1 June 2011
Aims. We carried out high-resolution spectroscopy and BV(I)C photometric monitoring of the two fastest late-type rotators in the nearby β Pictoris moving group, HD 199143 (F7V) and CD−64°1208 (K7V). The motivation for this work is to investigate the rotation periods and photospheric spot patterns of these very young stars, with a longer term view to probing the evolution of rotation and magnetic activity during the early phases of main-sequence evolution. We also aim to derive information on key physical parameters, such as rotational velocity and rotation period.
Methods. We applied maximum entropy (ME) and Tikhonov regularizing (TR) criteria to derive the surface spot map distributions of the optical modulation observed in HD 199143 (F7 V) and CD−64°1208 (K7 V). We also used cross-correlation techniques to determine stellar parameters such as radial velocities and rotational velocities. Lomb-Scargle periodograms were used to obtain the rotational periods from differential magnitude time series.
Results. We find periods and inclinations of 0.356 days and 21.5 deg for HD 199143, and 0.355 days and 50.1 deg for CD−64°1208. The spot maps of HD 199143 obtained from the ME and TR methods are very similar, although the latter gives a smoother distribution of the filling factor. Maps obtained at two different epochs three weeks apart show a remarkable increase in spot coverage amounting to ~7% of the surface of the photosphere over a time period of only ~20 days. The spot maps of CD−64°1208 from the two methods show good longitudinal agreement, whereas the latitude range of the spots is extended to cover the whole visible hemisphere in the TR map. The distributions obtained from the first light curve of HD 199143 show the presence of an extended and asymmetric active longitude with the maximum filling factor at longitude ~325°. A secondary active longitude is present at ~100°. The spotted area distributions on CD−64°1208 show two active longitudes separated by about 180°, which is not unusual on such very active stars.
Key words: stars: solar-type / starspots / stars: activity / stars: rotation / stars: individual: HD 199143 / stars: individual: CD-64 1208
Figures 7–10 are available in electronic form at http://www.aanda.org
© ESO, 2011
1. Introduction
Moving groups (MGs) are kinematically coherent groups of stars that probably share a common origin – the evaporation of an open cluster, the remnants of a star formation region, or a juxtaposition of several small star formation bursts at different epochs in adjacent cells of the velocity field. Recent years have seen the discovery of several MGs within 100 pc of the Sun (e.g.; TW Hydrae, Horologium-Tucana and β Pictoris). Stars in these groups range between millions and tens of million years in age, and their study should tell us about the formation and evolution of sparse stellar associations. The stars themselves provide a rare glimpse of the very earliest main-sequence evolution and an opportunity to study magnetic activity at its extremes. Young late-type fast rotating members of MGs offer a unique laboratory for studying stellar dynamos, magnetic structures and coronal heating.
The β Pictoris moving group (BPMG) is one of the youngest (~12 Myr, Kaisler et al. 2004) and the closest MGs to the Sun (~36 pc, Zuckerman et al. 2001). Zuckerman et al. (2001) and Song et al. (2003) report a total of 35 known members of the BPMG, each with one or more characteristics indicative of extreme youth. Kaisler et al. (2004) found a high lithium abundance in one of the BPMG members. The best-known members of the BPMG are early-type stars, whereas few studies have concentrated on the late-type stars representing three fourths of the known BPMG membership. The rotational properties of the late-type members have been recently investigated by Messina et al. (2010) as part of the RACE-OC project.
We have carried out high resolution spectroscopy and BV(I)C photometric monitoring of a selected sample of young late-type stars (spectral type later than F2). The sample chosen for this work has been selected from previously established members of the BPMG, based on photometric and kinematic properties. The motivation for this work is to investigate the rotation periods and photospheric spot patterns of these very young stars, with a longer-term view to probing the evolution of rotation and magnetic activity during the early phases of main-sequence evolution.
Here, we present results for two members of our sample, HD 199143 and CD−64°1208. These are the fastest rotators among the known late-type stars in the BPMG. HD 199143 has a vsini of 128 km s-1 (Torres et al. 2006) which is the largest of any known single solar-like star within 50 pc. van den Ancker et al. (2000) proposed that HD 199143 has been spun up by accretion of material from a close T Tauri-like companion responsible for the emission lines, the ultraviolet variability and the excess infrared emission. In the case of CD−64°1208, vsini > 100 km s-1 (Zuckerman et al. 2001) and its unusually strong Li for a 10 Myr old star has been postulated as possibly being due to its very fast rotation (Soderblom et al. 1993). Both stars represent a special opportunity to study the stellar atmospheric activity in young solar-like ultra-fast rotators.
Further information on the targets and observations are given in Sects. 2 and 3 respectively. Stellar parameters, time series analysis and phasing of the light curves are described in Sects. 4–6 respectively. The spot map distributions are shown in Sect. 7, while in Sect. 8 we present the results. The conclusions are given in Sect. 9.
2. HD 199143 and CD−64°1208
As members of the young β Pictoris moving group, the F7 dwarf HD 199143 (d = 47.7 pc) and the K 8 dwarf CD−64°1208 (d = 29.2 pc) probe the immediate post-T Tauri phase, during which stars contract to the zero-age main sequence. HD 199143, is a wide (1′) binary system. It has the largest vsini of any solar-like star known within 50 pc (vsini = 128 km s-1, Torres et al. 2006). HD 199143 forms a physical pair with the Li-rich late-type dwarf BD−176128. It exhibits strong chromospheric activity in Hα and in the ultraviolet (van den Ancker et al. 2000). The metallicity of HD 199143, as estimated from photometric indices in the survey of Nordström et al. (2004), is [Fe/H] = −0.07. Its logarithmic X-ray luminosity (in erg s-1) as measured with ROSAT is log Lx = 30.56, but log (Lx(Lbol) is –3.3 (Zuckerman et al. 2001), which puts the star below saturation (Jeffries & Maxted 2005). If the star has a short period (<0.5 days), it would be placed in the supersaturation range (García-Alvarez et al. 2008).
CD−64°1208 is a triple system consisting of a visual binary (whose primary has a K8 V spectral type as estimated from BV(RI)C photometry (Zuckerman et al. 2001) with a separation of 0.18 arcsec and ΔK = 2.3 mag (Chauvin et al. 2010) and a wide A7 V companion at a distance of 70 arcsec (HIP 92024). A spectrum obtained with the Double Beam Spectrograph (DBS) at the 2.3 m telescope in SSO (Zuckerman et al. 2001) is dominated by the K8 V component andshows strong Hα in emission (EW ~ 2.2 Å), a strong Li 6708 Å feature (EW ~ 580 mÅ) and fast rotation. The unusually strong Li signature is possibly due to its very fast rotation (e.g., see Soderblom et al. 1993).
In principle, the dilution of the optical flux of CD−64°1208 by its close visual companion may affect its light variations and have an impact on the spot modelling. If the companion is a late-type active star, say later than F5 V, and rotates with a period commensurable with that of the target star, its rotational modulation may produce a spurious additional signal in phase with the light variation of CD−64°1208 that will introduce a systematic error on the derived distribution of its spotted area vs. longitude. An upper limit for this error can be estimated by assuming that the V − K colour of the visual companion is at least 1.10 mag, corresponding to a star of spectral type F5 V (cf. Cox 2000,Sect. 7.5), and that its optical light modulation has an amplitude of 0.2 mag, i.e. comparable with that of CD−64°1208. Thus, the upper limit to the relative optical flux variation of the companion is ΔFV(FV = 8.8 × 10⁻³, which implies a maximum systematic error in the evaluation of the total spotted area of the target of ~0.9 per cent of the star disc, on the hypothesis of completely dark spots. Since the companion is likely to be significantly cooler than F5 V, the actual error may be considerably smaller and may be safely neglected, given that the amplitude of the light variation of the target is ~0.2 mag in the V passband, corresponding to a maximum spotted area of ~17 per cent of the star’s disc (cf. Sect. 3).
The log of the BV(I)C photometric observations of the targets from SAAO and SSO.
3. Observations
3.1. Photometry
Photometric observations of the stars HD 199143 and CD−64°1208 were obtained with Cousins BV(I)C filters during 2005 using telescopes at the South African Astronomical Observatory (SAAO) and the Siding Spring Observatory (SSO), Australia, and are summarised in Table 1. SAAO observations were made using the Modular Photometer on the 0.5 m telescope at Sutherland. The observations were made with reference to the Cousins UBV(RI)C standards in the E-regions (Menzies et al. 1989). SSO observations employed the 0.6-m reflector and PMT detector. The measurements of targets, HD 199143 and CD−64°1208, were alternated with two comparison stars. The light curves of HD 199143 and CD−64°1208 are shown in Figs. 1 and 2 respectively.
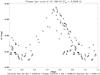 |
Fig. 1 The V-band differential magnitude of HD 199143 versus the phase as given by Eq. (1). Different symbols refer to different epochs of observation as indicated (MJD = HJD−2 4500 000). |
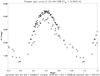 |
Fig. 2 The V-band differential magnitude of CD−64°1208 versus the phase as given by Eq. (2). Different symbols refer to different observational epochs as indicated (MJD = HJD−24 500 000). |
3.2. Spectroscopy
High resolution spectra of HD 199143 and CD−64°1208 were obtained during August 2004 at SAAO, using the GIRAFFE fibre-fed echelle spectrograph attached to the 1.9-m Radcliffe telescope. This instrument is a copy of the MUSICOS spectrograph currently in use on the Bernard Lyot telescope at Pic du Midi Observatory, France (Baudrand & Bohm 1992). The resolving power is λ(Δλ ≈ 42 000, corresponding to a width of 2 pixels of the 1024 × 1024 TEK CCD. A Th-Ar arc lamp was used for wavelength calibration. Arc spectra were taken at regular intervals to calibrate possible drifts. Flat-fielding was performed by taking the spectrum of a tungsten lamp and also by illuminating the CCD with uniform light through a diffusing screen. The wavelength range was 4300–6680 Å spread over 52 orders. Table 2 gives the log of the observations.
The spectra were reduced in a standard fashion, after which the continuum was normalized to unity. Spectral regions centred on some prominent lines of interest are shown in Fig. 3, together with the spectra of stellar “templates” of similar spectral type obtained during the same campaign. Highly broadened (FWHM > 250 km s-1) photospheric absorption lines (most prominently Hα, the Mg I triplet, the Na I doublet and Hβ) are visible in the spectra of both HD 199143 and CD−64°1208. The same lines are present in the template stellar spectra, but are, as expected, much narrower.
The log of spectroscopic observations of the targets and standard stars from SAAO.
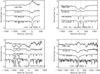 |
Fig. 3 High-resolution spectra of HD 199143 and CD−64°1208. For comparison, we also show the spectra of template stars with similar spectral types. |
4. Stellar parameters
4.1. Radial velocity and space motions
Heliocentric radial velocities were determined using the cross-correlation technique. The spectra of each star were cross-correlated order by order, using the routine fxcor in IRAF, against spectra of radial velocity standards of similar spectral types (see Table 2). For each order, the velocity is derived from the position of the peak of the cross-correlation function (CCF) found by fitting a Gaussian to the top of the function. Radial velocity errors are computed by fxcor based on the fitted peak height and the antisymmetric noise as described by Tonry & Davis (1979). The radial velocities calculated for each order are weighted by their errors, and a mean value is obtained for each observation. Orders including chromospheric features and prominent telluric lines were excluded when determining this mean velocity. Finally, a weighted mean radial velocity is determined using all the observations from all the observing runs. In Table 3 we list the average heliocentric radial velocity (Vhel) and its associated error (σVhel). The final mean radial velocities we have obtained for HD 199143 and CD−64°1208 are vr = 2.5 and vr = 2.2 km s-1, respectively.
Stellar parameters.
We have used these mean radial velocities, together with the spectroscopic parallaxes (d = 47.7 and 29.2 pc) and proper motions from the Tycho-2 Catalogue (Høg et al. 2000), to calculate the Galactic space-velocity components (U, V, W) in a right-handed coordinated system (positive in the directions of the Galactic center, Galactic rotation, and the North Galactic Pole, respectively), as determined by Montes et al. (2001). The resultant values are given in Table 3. The positions of HD 199143 and CD−64°1208 in the Galaxy velocity diagram confirm their membership of the BPMG. These values are similar to those reported by (Zuckerman et al. 2001).
4.2. Rotational velocity
To determine an accurate rotational velocity for HD 199143 and CD−64°1208, we again make use of the IRAF fxcor cross-correlation routine. For each of the observing runs, the observed spectra of HD 199143 and CD−64°1208 were cross-correlated against the spectrum of the template star and the width (FWHM) of the cross-correlation function (CCF) determined. The calibration of this width to yield an estimate of vsini is done by cross-correlating artificially broadened spectra of the template star with the original template star spectrum. Broadened template spectra are created for vsini spanning the expected range of values by convolution with a theoretical rotational profile using the program starmod. The resultant relationship between vsini and FWHM of the CCF was then fitted with a fourth-order polynomial. We have tested this method with stars of known rotational velocity and similar spectral type to HD 199143 and CD−64°1208. On average, we have obtained values with errors of about 5% compared with those from the literature. The uncertainties in the vsini values obtained by this method have been calculated using the parameter R defined by Tonry & Davis (1979) as the ratio of the CCF height to the rms antisymmetric component. This parameter is computed by the IRAF task fxcor and provides a measure of the signal-to-noise ratio of the CCF. Tonry & Davis (1979) show that errors in the FWHM of the CCF are proportional to (1 + R)-1, and Hartmann et al. (1986) and Rhode et al. (2001) found that the quantity ±vsini(1 + R)-1 provides a good estimate for the 90% confidence level of a vsini measurement. Thus, we have adopted ±vsini(1 + R)-1 as a reasonable estimate of the uncertainties in our vsini measurements.
We have determined vsini by this method for all the spectra available for HD 199143 and CD−64°1208. We found vsini values that match within the errors by using spectra from different nights and at different epochs. We note that vsini derived by this method is not sensitive to possible asymmetries of the CCF caused by starspots: such changes are mainly in the peak of the CCF, whereas the vsini determination is based on the FWHM. The resulting error-weighted means for all the observing runs for HD 199143 and CD−64°1208 are 115.5 ± 7.5 and 121.3 ± 15.3 km s-1, which are the values given in Table 3. These values are very similar to those given by Torres et al. (2006). Weise et al. (2010) obtained a larger value of vsin i = 161 ± 12 km s-1 for HD 199143. They cross-correlated the stellar spectra (3900–6800 Å) with appropriate numerical templates for the respective stellar spectral type (see Baranne et al. 1979).
5. Time series analysis: the search for rotation periods
The spectral types and measured vsini values confirm that HD 199143 and CD−64°1208 are fast rotators with periods Prot < 1 days. We therefore limited the search for periodicity in the V-band differential photometry to the range 0.1−10.0 days to allow for possible modulations on shorter as well as longer periods. We applied the Lomb-Scargle periodogram (Scargle 1982) for unevenly spaced data following the prescriptions of Horne & Baliunas (1986).
For HD 199143, the Lomb-Scargle periodogram shows the maximum power at a period of 0.3558 days with a false-alarm probability smaller than 10-6. The formal error on such a period is 0.004 days as derived from the FWHM of the corresponding periodogram peak, and is determined by the limited time extension of the data set (only 29.5 days). However, putting the V-band magnitude in phase with the 0.3558-d period, we find that a period change as small as 0.001 days gives rise to a significant increase in the dispersion of the light curve points. Therefore, we prefer to assume the latter as the most probable error of the period determined.
Visual inspection of the differential magnitude time series (see Fig. 4) shows how good the agreement is between the data and the sinusoidal fit with the 0.3558-d rotation period. We have retrieved contemporary V-band observations of HD 199143 from the ASAS archive (All Sky Automated Survey, (Pojmansli 1997) and these are plotted together with our own observations. Also, the ASAS data agree with the period we found. We have searched for the rotation period also in the ASAS time series. However, owing to the low precision of HD 199143, ASAS photometry (~0.035 mag) and the low amplitude of the rotational modulation (~0.055 mag), our period search did not allow us to derive any significant periodicity.
For CD−64°1208, the Lomb-Scargle periodogram exibits two peaks of comparable power and significance level greater than 99%, one at P = 0.3545d and another at P = 0.5459d. However, only the shorter period, when combined with the estimated stellar radius (R = 1.1 R⊙), gives an equatorial velocity consistent with the measured vsini = 121.3 km s-1. Moreover, our rotation period estimate is confirmed by the P = 0.345 ± 0.04 d value as determined by (Messina et al. 2010) making use of the ASAS photometry. In fact, in the case of CD−64°1208, although the ASAS photometry has a precision similar to that of HD 199143, the rotational modulation is a factor 3 larger (~0.16 mag), thus allowing them safely to establish the rotation period. A significant periodicity was found in 7 out of the 12 time segments in which the entire ASAS time series was sectioned. The error in our derived period can be assumed to be of the order of 0.001 days because a larger uncertainty significantly increases the dispersion of the light curve points. On the other hand, the periodicity at 0.5459 d may be the result of aliasing and noise fluctuations affecting our time series.
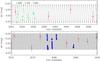 |
Fig. 4 The V-band differential magnitude of HD 199143 versus time with overplotted a sinusoidal fit with the rotation period of 0.3558 d. Different symbols refer to different observatories, as labelled. |
6. Phasing of the light curves
The observations of HD 199143 are phased with the ephemeris:  (1)giving the epoch of the minimum light. The V-band light curve is shown in Fig. 1, where different symbols refer to observations collected at different epochs in order to show how the shape of the light modulation changes vs. time. Specifically, three intervals can be identified during which the light curve remains stable, i.e. from HJD 2 453 555.02 to 2 453 558.32 (diamonds), from 2 453 578.34 to 2 453 580.52 (triangles) and from 2 453 584.43 to 2 453 584.52 (asterisks). The photometric points belonging to the first time interval sample the entire light curve, whereas those of the second interval show a gap between phases 0.2 and 0.5. A variation of the peak amplitude of the light curve is clearly evident between the two time intervals, making it impossible to put the data together to improve the phase sampling of the light curve. The third data set does not show any significant variation and covers only the phases between 0.75 and 0.80: these points will not be considered for the subsequent spot modelling. The brightest differential V magnitude along the whole time series is –0.295 and was assumed as the unspotted magnitude for the spot modelling of HD 199143. An inspection of the ASAS magnitudes – which better sample the range of variability because of their 9 year baseline - confirms that our choice of unspotted value is the correct one.
The observations of CD−64°1208 are phased with the ephemeris:  (2)The V-band light curve is plotted in Fig. 2, with different symbols indicating data collected at different times. Also in this case, three time intervals can be identified during which the light modulation remained more or less stable, i.e. from 2 453 473.14 to 2 453 486.27 (diamonds), from 2 453 554.87 to 2 453 558.26 (triangles) and from 2 453 579.27 to 2 453 584.37 (asterisks). The points of the first two data sets trace very similar light modulations, except for the phase interval between 0.7 and 1.0. However, they were considered together in order to improve the phase sampling of the combined light curve that was fitted with our spot model. The third data set consists of points between phases 0.15 and 0.6 that are systematically brighter than the corresponding points of the first and the second data sets. Since the systematic difference is about 0.025 mag, the most likely explanation is a decrease in the area of the component of the spot pattern uniformly distributed over the star that made it brighter. A change of the area of the order of 2–3% of the star disc over a time interval of about 20 days is enough to account for such a variation and cannot be considered unusual for such a very active star.
The brightest differential V magnitude throughout the whole time series is 0.829 and this was assumed as the unspotted magnitude for the spot modelling of CD−64°1208. As done in the previous case, we found that the correctness of this value is confirmed by the ASAS magnitudes timeseries.
7. Spot map distributions
7.1. Spot modelling technique
The classic Doppler Imaging technique can provide us with a map of the stellar photosphere of an active star (e.g., Strassmeier 2002, 2009) but its applicability is strongly limited in the present case owing to the extreme rotational broadening of the photospheric spectral lines. Therefore, spot modelling based on wide-band light curve fitting appears to be more appropriate for a preliminary characterization of the photospheric activity of our stars.
The reconstruction of the brightness distribution over the surface of a star by modelling the rotational modulation of wide-band optical fluxes is an ill-posed problem. The modulation provides information only on the variation of the projected spot area versus the rotation phase, i.e., the stellar longitude. In principle, it is possible to determine a unique spot distribution by minimizing the χ2 of the residuals between the observed and the model light curve, but such an approach is unsatisfactory because the solution is unstable, i.e. small variations in the input data lead to large changes in the spot map. This is due to the role played by the noise in the χ2 minimization, implying that most of the structure appearing on the spot map actually comes from the overfitting of the light fluctuations produced by intrinsic stellar variability or measurement errors.
It is possible to overcome the uniqueness and stability problems by introducing a regularizing function into the solution process. This corresponds to the a priori assumption of some specific statistical properties for the spot map, which allows us to select one stable map among the potentially infinite maps that can fit a given light curve. The two most used a priori assumptions are the maximum entropy (hereinafter ME; Gull & Skilling 1984; Vogt et al. 1987) and the Tikhonov (hereinafter TR; Piskunov et al. 1990) regularizations. These are particularly well-suited when the spot map consists of an array that specifies the spot covering factor in each surface element of the model star. The covering factor f gives the specific intensity I of each surface element according to the definition: I = (1 − f)Iu + fIs, where Iu is the specific intensity of the unspotted photosphere of the surface element, Is that of the spotted photosphere, and 0 < f < 1.
A detailed description of the application of the ME and TR regularizations to spot modelling problems was presented by Lanza et al. (1998) to whom we refer the reader for a detailed discussion of our approach. Here we only recall that the ME spot maps are computed by a constrained minimization of a functional QME,  (3)whereas the TR maps are computed by the constrained minimization of
  (4)Here, χ2 is the normalized sum of the squared residuals between the observed and the synthesized light curves, S is the entropy of the spot map, TR is the Tikhonov functional of the spot map, and λME > 0 and λTR > 0 are the Lagrange multipliers for the ME and the TR regularizations, respectively. The explicit expressions for S and TR, and the procedure of evaluation of the Lagrange multipliers are described by Lanza et al. (1998).
The synthesized light curve for a given distribution of the covering factor is computed by adopting a spheroidal geometry for the star, i.e. it is represented as an ellipsoid of semi-axes a = b and c < a, whose flattening is due to the centrifugal potential produced by the rapid rotation. We compute the flattening in the Roche approximation as  (5)where c is the polar radius, a the equatorial radius, Ω the angular velocity of rotation, M the mass of the star and G the gravitation constant. The effective temperature T on the photosphere of a distorted star depends on the local gravity (e.g., Kallrath & Milone 1999). For a star having an outer convective envelope, a good approximation is given by
 ![\begin{equation} T = T_{\rm p} \left[ 1 + 0.08 \times \left( \frac{g-g_{\rm p}}{g_{\rm p}} \right) \right], \label{gravdark} \end{equation}](/articles/aa/full_html/2011/09/aa16646-11/aa16646-11-eq101.png) (6)where Tp is the effective temperature at the pole, g is the local surface gravity and gp is the gravity at the pole. By considering such a gravity darkening effect, we compute the distribution of the effective temperature on the surface of the star and adopt Kurucz (2000) models to compute the brightness emerging from each surface element. Adding the effect of the limb-darkening, treated in the linear approximation, we derive the unperturbed brightness Iu over the stellar photosphere. The brightness of the spotted photosphere is given by: Is = CsIu, where the contrast Cs depends on the spot effective temperature and is assumed constant over the photosphere of the star. In order to compute the emerging flux with a relative precision of the order of 10-4, the stellar photosphere is subdivided into squared elements of side se = 1°, the fluxes of which are summed to compute the total flux from the stellar disc.
(6)where Tp is the effective temperature at the pole, g is the local surface gravity and gp is the gravity at the pole. By considering such a gravity darkening effect, we compute the distribution of the effective temperature on the surface of the star and adopt Kurucz (2000) models to compute the brightness emerging from each surface element. Adding the effect of the limb-darkening, treated in the linear approximation, we derive the unperturbed brightness Iu over the stellar photosphere. The brightness of the spotted photosphere is given by: Is = CsIu, where the contrast Cs depends on the spot effective temperature and is assumed constant over the photosphere of the star. In order to compute the emerging flux with a relative precision of the order of 10-4, the stellar photosphere is subdivided into squared elements of side se = 1°, the fluxes of which are summed to compute the total flux from the stellar disc.
Absolute properties of the spots cannot be extracted from single-band data because systematic and other errors arise from the unknown unspotted light level of the star and the assumption of single-temperature spots. Specifically, the brightest magnitude observed in such active stars is probably fainter than the true unspotted magnitude because spots may always be present on their photospheres. However, our model can be applied to derive a map of the component of the spot pattern unevenly distributed vs. longitude (for example, see Lanza et al. 2006,for a detailed discussion and a comparison with the capabilities of Doppler Imaging maps). The uniformly distributed component of the spot pattern cannot be derived because we assume that the unspotted magnitude is that corresponding to the brighter hemisphere of the star. Only when a long-term sequence of seasonal light curves is available can we extract information on the variation of the uniformly distributed spot pattern from season to season (cf. Lanza et al. 2002).
7.2. Model parameters
In our spot maps, we consider squared surface map elements of side s = 18°. while fluxes are always computed with the finer subdivision se = 1°. The stellar parameters adopted for the modelling of the two objects are listed in Table 4 together with the reference from which they were taken. The spot temperatures are estimated from the B − V and V − I colour variations according to Messina et al. (2006) and Messina & Guinan (2006).
Specifically, we model the amplitude of the V magnitude versus B − V and V − I colour variations induced by the cool/hot spots on the stellar photosphere for a grid of spot temperatures and filling factors using the Dorren approach (Dorren 1987) and the Hauschildt et al. (Hauschildt et al. 1999) atmosphere models. A χ2 minimization is used to select the solutions that best fit the observed amplitudes. As expected, the solutions are not unique and the higher the spot temperature, the higher their filling factor values. However, the solutions tend to cluster around a finite range of values for the spot temperature. Such a finite range of temperature values is adopted as the uncertainty of our spot temperature determination, which is about ±150 K for both stars under analysis. Assuming that the observed magnitude and colour variations arise from both cool and hot spots, what we infer from our modelling is an average value for the temperature inhomogeneities. In the case of HD 199143 the spot temperature inferred from either B − V or V − I is in agreement within the computed uncertainty. For CD−64°1208, the spot temperature derived from the B − V colour is about 200 K warmer than that derived from the V − I colour, probably because of the excess flux of faculae mainly affecting the B-band (Messina et al. 2006).
Therefore, the V − I colour probably gives a better determination of the cool spot temperature; we estimate an uncertainty of ±150 K for both stars. It is important to note that cool spots dominate the flux variation of both stars in the V-band whereas the possible facular component can be regarded as a second order effect in such extremely active stars (cf. the case of HR 1099 as analysed and discussed by Vogt et al. 1999). Therefore, the temperature of the cool spots is the only one appropriate for our modelling of the optical flux rotational modulation. From the effective temperatures of the spotted and the unperturbed photospheres, the spot contrast Cs ≡ Is(Iu at the disc centre is evaluated by means of Kurucz models, adopting the same mean gravity (see the values listed in Table 4).
Stellar parameters of HD 199143 and CD−64°1208 adopted for our spot modelling.
The linear limb-darkening coefficients in the V-band, uV, are assumed to be the same for the spotted and unspotted photospheres, which does not introduce any significant systematic error given that the difference between the two coefficients is less than 15% , and that the spots occupy a maximum fraction of the order of 10% of the stellar disc.
Results of the spot modelling of the light curves of HD 199143 and CD−64°1208.
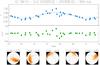 |
Fig. 5 Upper panel: the first light curve of HD 199143 (filled dots) with the corresponding synthetic light curve from the ME best fit spot distribution (solid line). The flux is given in relative units, assuming as the reference value (1.0) the brightest observation of the star (see Sect. 2). Middle panel: the residuals between the observations and the model in relative units. Lower panel: the ME spot map of the star in orthographic projection, showing the disc of the star as it would be seen by an observer on the Earth at the labelled rotation phases (see the text). |
The inclination i of the stellar rotation axis with respect to the line of sight is derived from the observed vsini, the estimated stellar equatorial radius a and the rotation period Prot found in Sect. 5. Given the errors in the measurements of vsini, the error in the inclination is of the order of 10°−15°. Nevertheless, changing the inclination does not significantly affect the distribution of the relative spotted area vs. longitude that is the primary result of our modelling.
The rapid rotation of the two stars produces a remarkable centrifugal flattening that makes it necessary to include gravity darkening and ellipsoidicity in the stellar model. Any systematic error in the estimation of such effects modifies the unperturbed flux level of the star. However, to first order there is no difference in the spotted area between the most and the least spotted hemispheres, and the component of the spotted area unevenly distributed in longitude can be safely mapped.
8. Results
The results of our spot modelling are summarized in Table 5. The reduced χ2 is defined as:  (7)where Oi is the observed flux and Fi the computed flux at the ith rotational phase. The standard deviation used to compute the best fit for each light curve has been derived a posteriori by considering the standard deviation of the differences between the observations and the best fit flux values, both normalized to the maximum observed flux. It is comparable with the a priori standard deviation expected from the accuracy of the photometry for the first light curve of HD 199143 and the light curve of CD−64°1208 (i.e. 0.005 mag), whereas it is about 2 times smaller for the second light curve of HD 199143.
The best fit of the first light curve of HD 199143 is shown in Fig. 5, together with the ME spot map in orthographic projection as seen by an observer looking at the star from the Earth. The north pole is always in view because of the small inclination of the rotation axis of the star. The reference frame is chosen so that the longitude of the central meridian of the stellar disc at rotation phase φ (with 0 < φ < 1) is 360° × φ. The T-regularized best fit and the corresponding spot maps are shown in Fig. 6. The ME- and the T-regularized best fits of the second light curve of HD 199143 and of the light curve of CD−64°1208 are shown in Figs. 7–10, respectively, together with the corresponding spot maps.
The spot maps of HD 199143 obtained with the ME and the T regularizations are remarkably similar, although the TR criterion gives a smoother distribution of the filling factor, as expected on the basis of its a priori assumptions that select the smoothest spot distribution that fits the data. The latitude of the spots is confined below ~60° in the first map and below ~30° in the second map. This is due to the low inclination angle of the rotation axis that makes it necessary to put spots away from the north pole (which is always in view) to produce a sizeable magnitude variation vs. stellar rotation phase. The second light curve has a larger amplitude than the first one, making it necessary to increase the filling factor and put the spots at lower latitudes to reproduce the observed amplitude. The lack of spotted area in the ME map between longitudes 100° and 200° is due to the lack of data in the second light curve to constrain the spot pattern in the corresponding phase range. We note the remarkable increase in the total area of the spot component unevenly distributed in longitude required to fit the light curve amplitude variation. The ME solutions give an increment of ~7% of the entire photosphere on a time scale of only ~20 days.
The spot maps of CD−64°1208 obtained with the ME and the T regularizing criteria show good longitudinal agreement whereas the latitude range of the spots is extended to cover the whole visible hemisphere in the TR map. This is due to the lack of latitudinal constraints on the spot location due to the higher inclination of the stellar rotation axis. Therefore, in the case of CD−64°1208 what we can retrieve from the light curve modelling is basically the distribution of the non-uniform component of the spotted area vs. longitude.
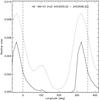 |
Fig. 11 The distribution of the spotted area vs. longitude for the ME (solid line) and the TR (dotted line) models of the first light curve of HD 199143. The area unit is the surface of the star. The distributions have been plotted between −60° and 420° to better display the structure of the spot pattern; the longitude interval 0°−360° is marked by two vertical dashed lines. |
The distributions of the spotted area vs. longitude are shown in Figs. 11, 12 for the light curves of HD 199143 and in Fig. 13 for the light curve of CD−64°1208, respectively. The distributions obtained with the ME and TR methods are always very similar although there is a systematic difference between the ME and the TR areas, the latter being systematically greater than the former. This is due to the different assumptions of the two regularization methods, with ME trying to decrease the spotted area as much as possible while TR tries to make the spot distribution as uniform as possible. Therefore, the TR maps have spots in the invisible part of the stellar surface that systematically increase the total spotted area in each longitude bin. Of course, the spotted area projected onto the visible disc, which is responsible for the flux modulation, is the same for both solutions.
The distributions obtained from the first light curve of HD 199143 show the presence of an extended and asymmetric active longitude with the maximum filling factor at longitude ~325°. A secondary active longitude is present at ~100°. It appears to have grown significantly in the second light curve maps while the primary active longitude has migrated slightly towards decreasing longitudes. Unfortunately, the incompleteness of the second light curve makes such results on the spot pattern evolution quite uncertain.
The spot distribution derived for HD 199143 and CD−64°1208 can be compared with those obtained for the two fast-rotating main-sequence stars AB Dor and LO Peg. AB Dor is a K0 dwarf with a rotation period of 0.5148 days that has been extensively studied through spot modelling (e.g., Järvinen et al. 2005) and Doppler Imaging (e.g., Jeffers et al. 2007,and references therein). Spot modelling based on long-term seasonal photometry generally show one or two active longitudes that change from season to season. In Doppler images, it shows an asymmetric spotted polar cap of varying extension in addition to several low and intermediate latitude spots.
LO Peg is a K5-K7 dwarf with a rotation period of only 0.4236 days that has been Doppler imaged by, e.g., Barnes et al. (2005) and Piluso et al. (2008) showing an asymmetric polar cap with several appendages reaching 10°−20° of latitude. Therefore, the spot distributions obtained from our limited photometric datasets are in general agreement with those obtained for other rapidly rotating young late-type stars. The presence of a more or less asymmetric polar cap can be established only through Doppler imaging because it does not contribute significantly to the optical flux modulation that is dominated by intermediate and low-latitude spots. Of course, Doppler images have a greater spatial resolution than the maps obtained from the inversion of optical photometry and show that spots as small as a few degrees of longitudes are present on AB Dor and LO Peg. Therefore, our active longitudes are likely to be clusters of much smaller individual spots.
9. Conclusions
We have analysed photometric and high resolution spectroscopic observations, made during the period 2004–2005, to investigate the surface activity of the two fastest rotating late-type stars known in the β Pictoris young moving group. In addition to surface spot map distributions, these observations have yielded information on the key physical parameters of rotational velocity, rotation period, inclinations angle and radial velocity.
-
1.
Radial velocity standard stars have been used to calculateaccurate heliocentric radial velocities for each observation byusing the cross-correlation technique. The mean velocities forHD 199143 and CD−64°1208 are 2.2 ± 2.9 km s-1 and 2.5 ± 2.2 km s-1, respectively. These values were used to calculate the Galactic space-velocity components (U, V, W) and confirmed their membership of the BPMG.
-
2.
From cross-correlation analysis of our spectra, projected rotational velocities, vsini, of 115.5 ± 7.5 km s-1 and 121.3 ± 15.3 km s-1 have been measured for HD 199143 and CD−64°1208, respectively.
-
3.
Rotation periods of 0.356 ± 0.004 days for HD 199143 and 0.355 ± 0.040 days for CD−64°1208 have been derived from the time series of V-band differential magnitudes.
-
4.
The inclination, i, of the stellar rotation axis with respect to the line of sight has been derived from the observed vsini, the estimated stellar equatorial radius a, and the rotation period Prot. We find inclination angles of
 and 50° with an uncertainty of 10°−15° for HD 199143 and CD−64°1208, respectively.
 -
5.
The spot maps of HD 199143 obtained using the TR and ME criteria are remarkably similar; the TR criterion gives a smoother distribution of the filling factor, as expected. The latitude of the spots is confined below ~60° in the first map and below ~30° in the second map. Light curve amplitude variations over the different epochs of observation require an increase of ~7% in the spot filling factor, unevenly distributed in longitude, on a time scale of only ~20 days.
-
6.
The spot maps of CD−64°1208 show good longitudinal agreement whereas the latitude range of the spots is extended to cover the whole visible hemisphere in the TR map.
-
7.
The distributions obtained from the first light curve of HD 199143 show the presence of an extended and asymmetric active longitude with the maximum filling factor at longitude ~325°. A secondary active longitude is present at ~100°. It appears to have grown remarkably in the second light curve maps, while the primary active longitude has migrated slightly towards decreasing longitudes. The spotted area distributions on CD−64°1208 show two active longitudes separated by about 180° which is not unusual on such very active stars.
Online material
Acknowledgments
D.G.A. was supported by Chandra grants GO1-2006X and GO1-2012X. JJD and VK were supported by NASA contract NAS8-39073 to the Chandra X-ray Center. Research at Armagh Observatory is grant-aided by the N. Ireland Dept. of Culture, Arts and Leisure (DCAL). This paper uses observations made at the South African Astronomical Observatory (SAAO) and at the Siding Spring Observatory (SSO), Australia. This work was supported by the Spanish Ministerio de Ciencia e Innovacion (MCINN) under grant AYA2008-000695.
References
- Allen de Prieto, C., & Lambert, D. L. 1999, A&A, 352, 555 [NASA ADS] [Google Scholar]
- Baranne, A., Mayor, M., & Poncet, J. L. 1979, Vistas Astron., 23, 279 [NASA ADS] [CrossRef] [Google Scholar]
- Barnes, J. R., Cameron, A. C., Lister, T. A., Pointer, G. R., & Still, M. D. 2005, MNRAS, 356, 1501 [NASA ADS] [CrossRef] [Google Scholar]
- Baudrand, J., & Bohm, T. 1992, A&A, 259, 711 [NASA ADS] [Google Scholar]
- Chauvin , G., Lagrange, A.-M., Bonavita, M., et al. 2010, A&A, 509, 52 [Google Scholar]
- Cox, A. N. 2000, Allen’s Astrophysical Quantities, 4th edn. (Berlin, New York: Springer-Verlag) [Google Scholar]
- Cutispoto, G. 1998, A&AS, 127, 207 [NASA ADS] [CrossRef] [EDP Sciences] [Google Scholar]
- de la Reza, R., & Pinzón, G. 2004, AJ, 128, 1812 [NASA ADS] [CrossRef] [Google Scholar]
- Dorren, J. D. 1987, ApJ, 320, 756 [NASA ADS] [CrossRef] [Google Scholar]
- García-Alvarez, D., Barnes, J. R., Collier Cameron, A., et al. 2003a, A&A, 402, 1073 [NASA ADS] [CrossRef] [EDP Sciences] [Google Scholar]
- García-Alvarez, D., Foing, B. H., Montes, D., et al. 2003b, A&A, 397, 285 [Google Scholar]
- García-Alvarez, D., Drake, J. J., Kashyap, V. L., Lin, L., & Ball, B. 2008, ApJ, 679, 1509 [NASA ADS] [CrossRef] [Google Scholar]
- Gull, S. F., & Skilling, J. 1984, in Indirect Imaging, ed. J. A. Roberts (Cambridge: Cambridge Univ. Press), 267 [Google Scholar]
- Hartmann, L., Hewett, R., Stahler, S., & Mathieu, R. D. 1986, ApJ, 309, 275 [NASA ADS] [CrossRef] [Google Scholar]
- Hauschildt, P. H., Allard, F., & Baron, E. 1999, ApJ, 512, 377 [NASA ADS] [CrossRef] [Google Scholar]
- Høg, E., Fabricius, C., Makarov, V. V., et al. 2000, A&A, 355, L27 [NASA ADS] [Google Scholar]
- Horne, J. H., & Baliunas, S. L. 1986, ApJ, 302, 757 [NASA ADS] [CrossRef] [Google Scholar]
- Järvinen, S. P., Berdyugina, S. V., Tuominen, I., Cutispoto, G., & Bos, M. 2005, A&A, 432, 657 [NASA ADS] [CrossRef] [EDP Sciences] [Google Scholar]
- Jeffers, S. V., Donati, J.-F., & Collier Cameron, A. 2007, MNRAS, 375, 567 [NASA ADS] [CrossRef] [Google Scholar]
- Jeffries, R. D., & Maxted, P. F. L. 2005, AN, 326, 944 [NASA ADS] [CrossRef] [Google Scholar]
- Kallrath, J., & Milone, E. F. 1999, Eclipsing binary stars: modelling and analysis (New York: Springer-Verlag) [Google Scholar]
- Kaisler, D., Zuckerman, B., Song, I., et al. 2004, A&A, 414, 175 [NASA ADS] [CrossRef] [EDP Sciences] [Google Scholar]
- Kurucz, R. 2000, http://cfaku5.harvard.edu [Google Scholar]
- Lanza, A. F., Catalano, S., Cutispoto, G., Pagano, I., & Rodonò, M. 1998, A&A, 332, 541 [NASA ADS] [Google Scholar]
- Lanza, A. F., Catalano, S., Rodonò, M., et al. 2002, A&A, 386, 583 [NASA ADS] [CrossRef] [EDP Sciences] [Google Scholar]
- Lanza, A. F., Piluso, N., Rodonò, M., Messina, S., & Cutispoto, G. 2006, A&A, 455, 595 [NASA ADS] [CrossRef] [EDP Sciences] [Google Scholar]
- Menzies, J. W., Cousins, A. W. J., Banfield, R. M., & Laing, J. D. 1989, SAAOC, 13, 1 [Google Scholar]
- Messina, S., & Guinan, E. F. Ap&SS, 2006, 304, 191 [NASA ADS] [CrossRef] [Google Scholar]
- Messina, S., Cutispoto, G., Guinan, E. F., Lanza, A. F., & Rodonò, M. 2006, A&A, 447, 293 [NASA ADS] [CrossRef] [EDP Sciences] [Google Scholar]
- Messina, S., Desidera, S., Turatto, M., Lanzafame, A. C., & Guinan, E. F. 2010, A&A, 520, A15 [NASA ADS] [CrossRef] [EDP Sciences] [Google Scholar]
- Montes, D., Fernandez-Figueroa, M. J., De Castro, E., & Cornide, M. 1995, A&A, 294, 165 [NASA ADS] [Google Scholar]
- Montes, D., López-Santiago, J., Gálvez, M. C., et al. 2001, MNRAS, 328, 45 [NASA ADS] [CrossRef] [MathSciNet] [Google Scholar]
- Mora, A., Merin, B., Solano, E., et al. 2001 A&A, 378, 116 [NASA ADS] [CrossRef] [EDP Sciences] [Google Scholar]
- Nordström, B., Mayor, M., Andersen, J., et al. 2004, A&A, 418, 989 [NASA ADS] [CrossRef] [EDP Sciences] [Google Scholar]
- Piluso, N., Lanza, A. F., Pagano, I., Lanzafame, A. C., & Donati, J.-F. 2008, MNRAS, 387, 237 [NASA ADS] [CrossRef] [Google Scholar]
- Piskunov, N. E., Tuominen, I., & Vilhu, O. 1990, A&A, 230, 363 [NASA ADS] [Google Scholar]
- Pojmanski, G. 1997, Acta Astron., 52, 397 [Google Scholar]
- Randich, S., Pallavicini, R., Meola, G., Stauffer, J. R., & Balachandran, S. C. 2001, A&A, 372, 862 [NASA ADS] [CrossRef] [EDP Sciences] [Google Scholar]
- Rebull, L. M., Wolff, S. C., & Strom, S. E. 2004, AJ, 127, 1029 [NASA ADS] [CrossRef] [Google Scholar]
- Rhode, K. L., Herbst, W., & Mathieu, R. D. 2001, AJ, 122, 3258 [NASA ADS] [CrossRef] [Google Scholar]
- Roberts, D. H., Lehár, J., & Dreher, J. W. 1986, AJ, 93, 968 [Google Scholar]
- Scargle, J. D. 1982, ApJ, 263, 835 [NASA ADS] [CrossRef] [Google Scholar]
- Schussler, M. 1983, IAU Symp., 102, 213 [NASA ADS] [Google Scholar]
- Soderblom, D. R., Fedele, S. B., Jones, B. F., Stauffer, J. R., & Prosser, C. F. 1993, AJ, 106, 1080 [NASA ADS] [CrossRef] [Google Scholar]
- Song, I., Zuckerman, B., & Bessell, M. S. 2003, ApJ, 599, 342 [Google Scholar]
- Strassmeier, K. G. 2002, Astron. Nachr. 323, 309 [NASA ADS] [CrossRef] [Google Scholar]
- Strassmeier, K. G. 2009, A&AR, 17, 251 [Google Scholar]
- Tonry, J., & Davis, M. 1979, AJ, 84, 1511 [NASA ADS] [CrossRef] [Google Scholar]
- Torres, C. A. O., Quast, G. R., da Silva, L., et al. 2006, A&A, 460, 695 [NASA ADS] [CrossRef] [EDP Sciences] [Google Scholar]
- van den Ancker, M. E., Pérez, M. R., de Winter, D., & McCollum, B. 2000, A&A, 363, 25L [Google Scholar]
- Vogt, S. S., & Penrod, G. D. 1983, PASP, 95, 565 [NASA ADS] [CrossRef] [Google Scholar]
- Vogt, S. S., Penrod, G. D., & Hatzes, A. P. 1987, ApJ, 321, 496 [NASA ADS] [CrossRef] [Google Scholar]
- Vogt, S. S., Hatzes, A. P., Misch, A. A., & Kürster, M. 1999, ApJS, 121, 547 [NASA ADS] [CrossRef] [Google Scholar]
- Weise, P., Launhardt, R., Setiawan, J., & Henning, T. 2010, A&A, 517, 88 [Google Scholar]
- Zuckerman, B., Song, I., Bessell, M. S., & Webb, R. A. 2001, ApJ, 562, L87 [NASA ADS] [CrossRef] [Google Scholar]
All Tables
The log of spectroscopic observations of the targets and standard stars from SAAO.
All Figures
|
Fig. 1 The V-band differential magnitude of HD 199143 versus the phase as given by Eq. (1). Different symbols refer to different epochs of observation as indicated (MJD = HJD−2 4500 000). |
| In the text | |
|
Fig. 2 The V-band differential magnitude of CD−64°1208 versus the phase as given by Eq. (2). Different symbols refer to different observational epochs as indicated (MJD = HJD−24 500 000). |
| In the text | |
|
Fig. 3 High-resolution spectra of HD 199143 and CD−64°1208. For comparison, we also show the spectra of template stars with similar spectral types. |
| In the text | |
|
Fig. 4 The V-band differential magnitude of HD 199143 versus time with overplotted a sinusoidal fit with the rotation period of 0.3558 d. Different symbols refer to different observatories, as labelled. |
| In the text | |
|
Fig. 5 Upper panel: the first light curve of HD 199143 (filled dots) with the corresponding synthetic light curve from the ME best fit spot distribution (solid line). The flux is given in relative units, assuming as the reference value (1.0) the brightest observation of the star (see Sect. 2). Middle panel: the residuals between the observations and the model in relative units. Lower panel: the ME spot map of the star in orthographic projection, showing the disc of the star as it would be seen by an observer on the Earth at the labelled rotation phases (see the text). |
| In the text | |
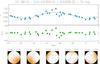 |
Fig. 6 As Fig. 5, but for the T-regularized best fit. |
| In the text | |
|
Fig. 11 The distribution of the spotted area vs. longitude for the ME (solid line) and the TR (dotted line) models of the first light curve of HD 199143. The area unit is the surface of the star. The distributions have been plotted between −60° and 420° to better display the structure of the spot pattern; the longitude interval 0°−360° is marked by two vertical dashed lines. |
| In the text | |
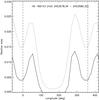 |
Fig. 12 As Fig. 11, but for the second light curve of CD−64°1208. |
| In the text | |
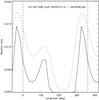 |
Fig. 13 As Fig. 11, but for the light curve of CD−64°1208. |
| In the text | |
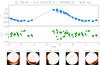 |
Fig. 7 As Fig. 5, but for the second light curve of HD 199143. |
| In the text | |
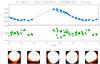 |
Fig. 8 As Fig. 6, but for the second light curve of HD 199143. |
| In the text | |
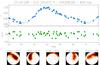 |
Fig. 9 As Fig. 5, but for the light curve of CD−64°1208. |
| In the text | |
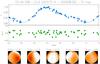 |
Fig. 10 As Fig. 6, but for the light curve of CD−64°1208. |
| In the text | |
Current usage metrics show cumulative count of Article Views (full-text article views including HTML views, PDF and ePub downloads, according to the available data) and Abstracts Views on Vision4Press platform.
Data correspond to usage on the plateform after 2015. The current usage metrics is available 48-96 hours after online publication and is updated daily on week days.
Initial download of the metrics may take a while.