Fig. 3
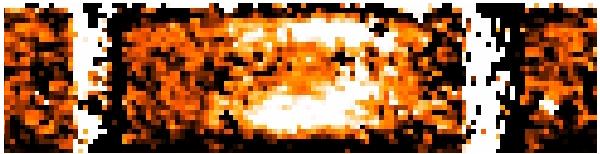
Zoom on the wavelength-calibrated rectified sky-subtracted 2D spectrum around the nebular emission line Hγ plotted between 1618 and 1625 nm. The wavelength scale grows from left to right, and the pixel scale perpendicular to the dispersion direction is equal to 0.2″/pixel. Residuals of two sky lines are observed on both sides of the Hγ emission. The lower trace corresponds to the Hγ emission from A2 and the upper trace to the Hγ emission from A3. In the lensed image A2, two emission components are clearly distinguishable in the 2D Hγ profile, separated in the spectral direction by ~130 km s-1 and in the spatial direction by ~1″. In the lensed image A3, one can also perceive two emission components, separated in the spectral direction only and with the bluest one being significantly weaker.
Current usage metrics show cumulative count of Article Views (full-text article views including HTML views, PDF and ePub downloads, according to the available data) and Abstracts Views on Vision4Press platform.
Data correspond to usage on the plateform after 2015. The current usage metrics is available 48-96 hours after online publication and is updated daily on week days.
Initial download of the metrics may take a while.