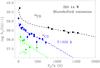
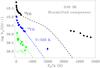
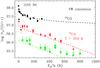
Fig. 8
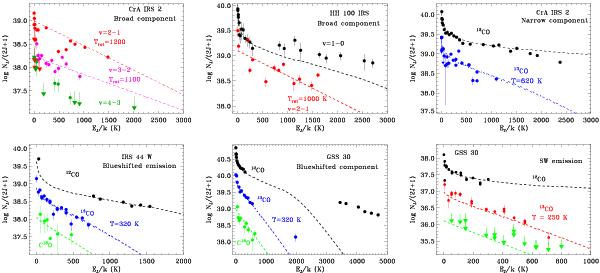
Plots of apparent column density versus excitation for CO emission for the broad and narrow emission components and spatially-extended emission. For the 12CO v = 1−0 lines, the synthetic fluxes are shown only for the P transitions. The dashed lines show the excitation expected from the N(CO) and T, based on models described in Sect. A.4.
Current usage metrics show cumulative count of Article Views (full-text article views including HTML views, PDF and ePub downloads, according to the available data) and Abstracts Views on Vision4Press platform.
Data correspond to usage on the plateform after 2015. The current usage metrics is available 48-96 hours after online publication and is updated daily on week days.
Initial download of the metrics may take a while.