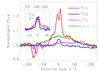
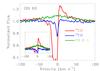
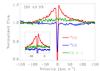
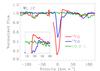
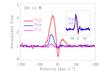
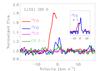
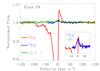
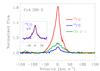
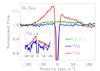
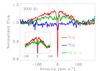
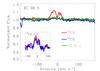
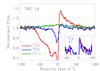
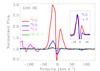
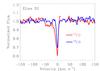
Fig. 6

Co-added line profiles from sources with detected CO emission. In each plot the 12CO v = 1−0 line is shown in red, the 13CO v = 1−0 line is shown in blue, the C18O v = 1−0 line is shown in pink (IRS 44 W and GSS 30), and 12CO v = 2−1 line is shown in green. Inserts zoom in to compare the 12CO emission line profile to that of 13CO, C18O, or v = 2−1, depending on the source.

Current usage metrics show cumulative count of Article Views (full-text article views including HTML views, PDF and ePub downloads, according to the available data) and Abstracts Views on Vision4Press platform.
Data correspond to usage on the plateform after 2015. The current usage metrics is available 48-96 hours after online publication and is updated daily on week days.
Initial download of the metrics may take a while.