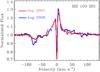
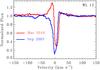
Fig. 16

Left: comparing the CO fundamental line profile from HH 100 as seen in observations separated by 11 months. The profiles shown here are the co-added lines of P(4), P(6), P(7), and P(8). No significant difference is seen in the emission line profile between the two epocsh. In August 2008 the wind absorption at −75 km s-1 was deeper than that seen in September 2007. Right: co-added CO emission from two observations of WL 12. The observation of September 2007 covered low-J lines while the observation of March 2010 covered high-J lines, so the comparison of line profiles is not direct. Some of the wind absorption in 2007 appears to go into emission in 2010.
Current usage metrics show cumulative count of Article Views (full-text article views including HTML views, PDF and ePub downloads, according to the available data) and Abstracts Views on Vision4Press platform.
Data correspond to usage on the plateform after 2015. The current usage metrics is available 48-96 hours after online publication and is updated daily on week days.
Initial download of the metrics may take a while.