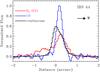
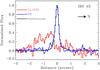
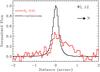
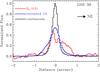
Fig. 13

Spatial profiles of M-band continuum emission, coadded 12CO v = 1−0 line emission, and H2 S(9) emission from four sources. The H2 emission from these four sources is much more extended than the CO and continuum emission, and is reminiscent of H2 v = 1−0 S(1) emission from outflows (Beck et al. 2008). The H2 emission from Elias 29, L1551 IRS 5, IRS 63, and WL 6 is not extended and not shown here. The CO emission from GSS 30 shown here is the blueshifted component between −20 and −10 km s-1. The CO emission on the line wings is not spatially extended beyond the continuum emission.
Current usage metrics show cumulative count of Article Views (full-text article views including HTML views, PDF and ePub downloads, according to the available data) and Abstracts Views on Vision4Press platform.
Data correspond to usage on the plateform after 2015. The current usage metrics is available 48-96 hours after online publication and is updated daily on week days.
Initial download of the metrics may take a while.