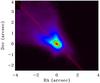
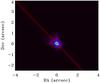
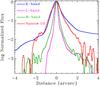
Fig. 11
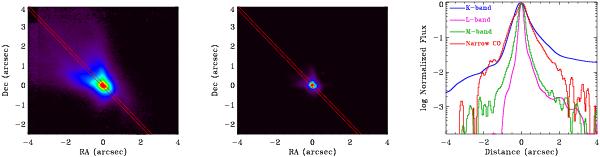
Top: VLT/NACO K-band (left) and L-band (right, provided by Duchêne) images of GSS 30, with the CRIRES slit in red. Nebulosity is detected to the NE and SW of the resolved central source. Bottom: the cross-dispersion profile of K-band, M-band, and narrow CO emission from GSS 30 along the CRIRES slit. The K-band emission is extracted from the NACO image, deconvolved to the  seeing during our CRIRES observation. The M-band continuum and the on-source CO emission are unresolved. That the M-band continuum emission is broader than the L-band continuum emission may be the result of broad wings on the CRIRES point-spread function, which we do not account for here. The extent of the narrow CO emission is somewhat similar to the K-band nebulosity.
Current usage metrics show cumulative count of Article Views (full-text article views including HTML views, PDF and ePub downloads, according to the available data) and Abstracts Views on Vision4Press platform.
Data correspond to usage on the plateform after 2015. The current usage metrics is available 48-96 hours after online publication and is updated daily on week days.
Initial download of the metrics may take a while.